Monitoring Platform
Overview of the dashboards and reports available in the Granica Console for tracking optimization activity, platform health, and cost savings.
The Granica Console provides four dedicated monitoring surfaces that give operators, data engineers, and executives a complete picture of optimization activity, platform health, and business value. Each dashboard is updated in near real-time and can be filtered by time window, table type, version, or bucket.
Overview
URL: / (Console home)
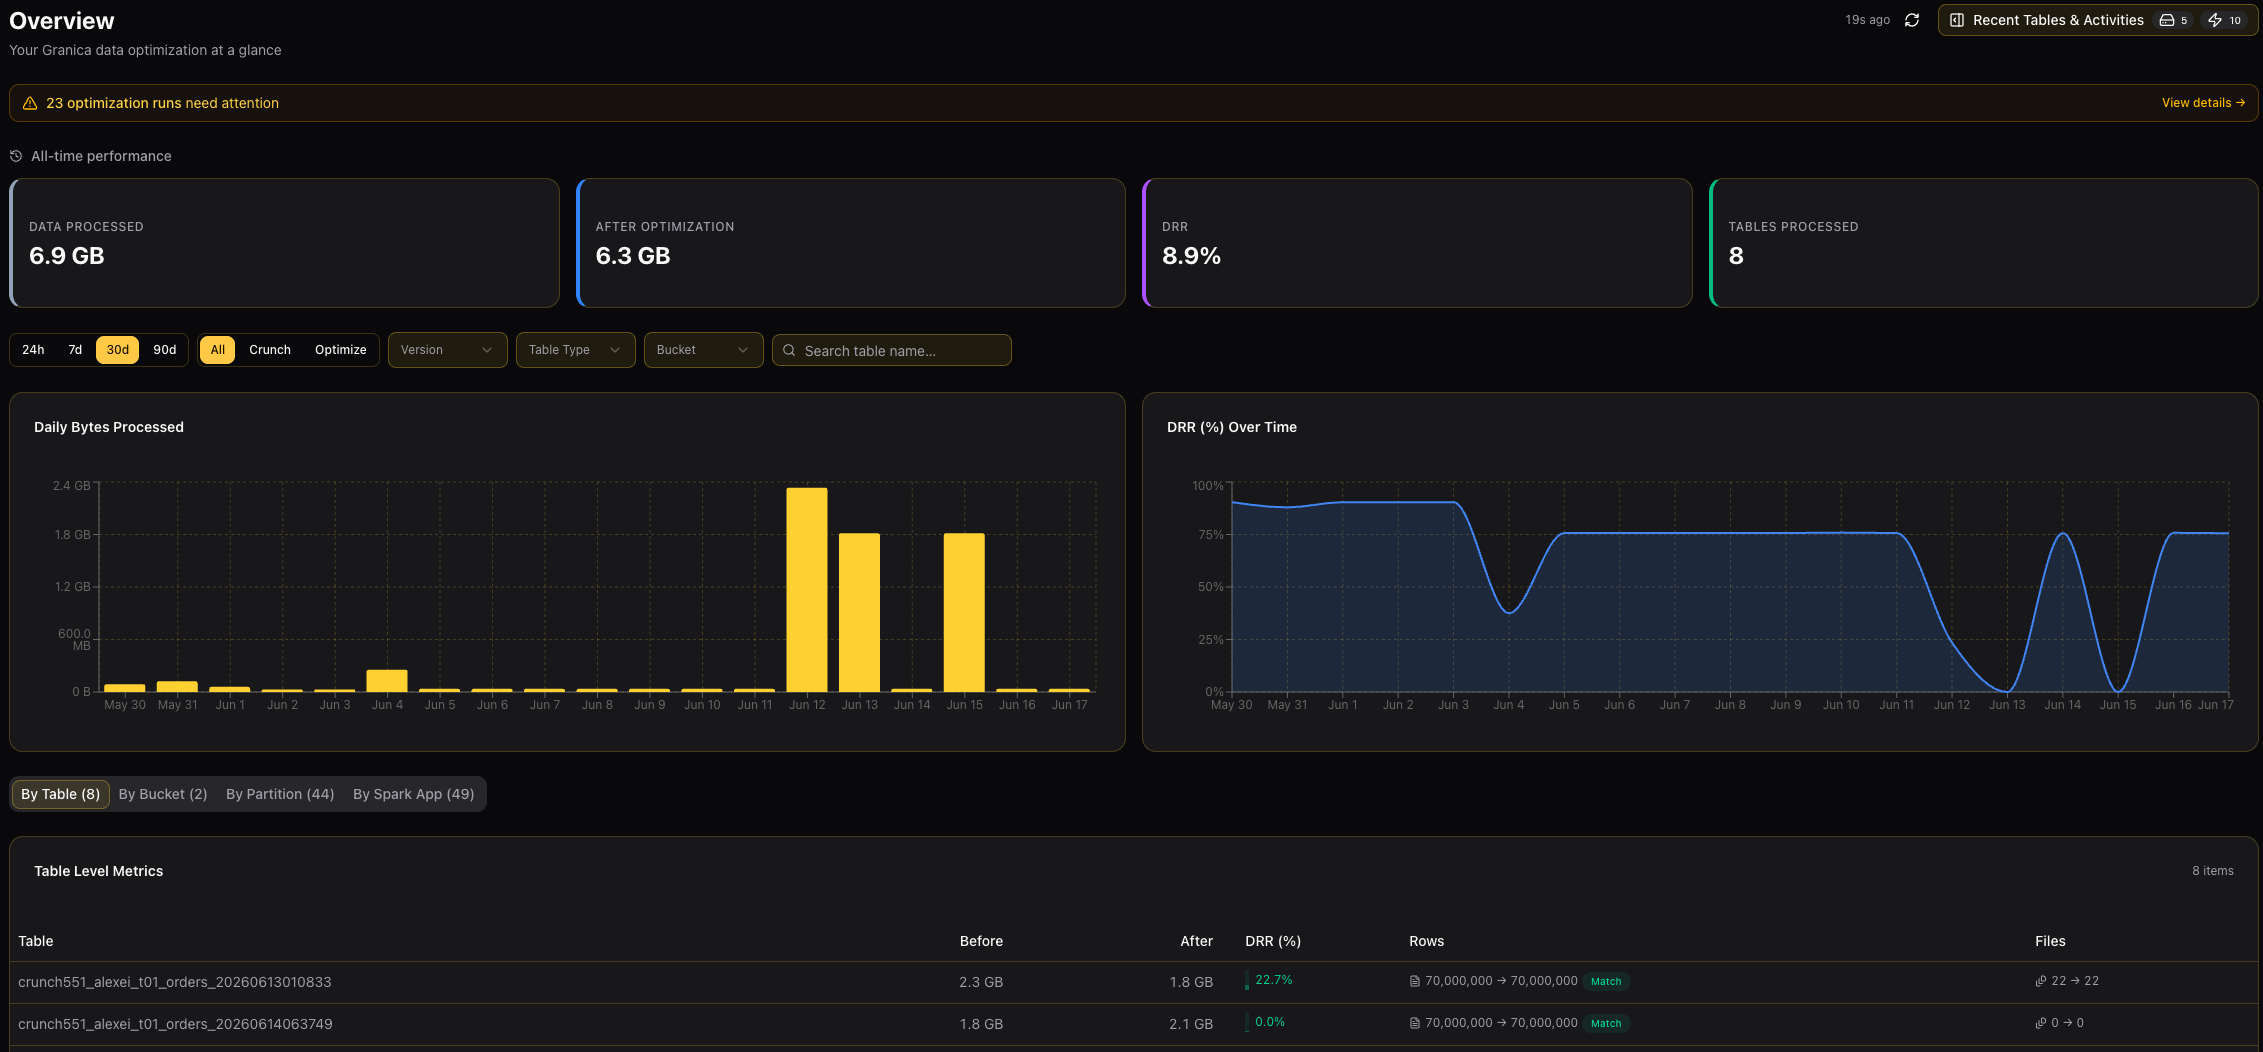
The Overview dashboard is the primary operational view. It gives a live, at-a-glance summary of how much data Granica has processed and the compression efficiency achieved.
All-time KPI cards
The four cards at the top of the page reflect all-time cumulative performance, independent of any date filters:
| Metric | Description |
|---|---|
| Data Processed | Total volume of data read by Granica across all crunch and optimize jobs |
| After Optimization | Total volume of data written after optimization — the smaller the gap with Data Processed, the higher the reduction |
| DRR | Data Reduction Ratio — the percentage of storage saved relative to the original size. Higher is better. |
| Tables Processed | Total number of distinct tables that have been optimized at least once |
Filters
Below the KPI cards, a filter bar lets you slice the detailed metrics and charts by:
- Time window — 24h, 7d, 30d, or 90d
- Job type — All, Crunch, or Optimize
- Version — Iceberg snapshot or Delta commit version
- Table Type — Iceberg, Delta Lake, or Hive
- Bucket — Filter to a specific cloud storage bucket
- Table name — Free-text search
Charts
| Chart | Description |
|---|---|
| Daily Bytes Processed | Bar chart showing data volume processed per day within the selected time window |
| DRR (%) Over Time | Line chart showing how the Data Reduction Ratio has trended day-by-day |
Breakdown tables
Below the charts, the Overview page breaks down metrics by four dimensions — switch between tabs to explore:
| Tab | What it shows |
|---|---|
| By Table | Per-table before/after size, DRR, row count match, and file count change |
| By Bucket | Aggregated metrics grouped by storage bucket |
| By Partition | Per-partition breakdown for tables with date or Hive partitioning |
| By Spark App | Metrics grouped by the Spark application ID that performed the work |
Each row shows Before and After sizes, the DRR (%), a row count Match indicator confirming data integrity was preserved, and a Files delta showing how many files were consolidated.
Attention alerts
A yellow alert banner appears at the top of the Overview when optimization runs have failed or require attention. Clicking View details jumps directly to the affected jobs in the Activities view.
Activities
URL: /activities
The Activities page is the job-level operational log. It shows every crunch and metadata collection job Granica has run, with filtering and search so you can quickly find jobs for a specific table or investigate failures.
Tabs
| Tab | Description |
|---|---|
| Summary | Aggregate view combining all job types — total jobs, in-progress, completed, failed, and skipped counts, plus average DRR and average job duration. Includes trend charts for DRR, duration, and daily job volume. |
| Crunch Jobs | Spark-level job detail table. Each row shows the table name, job type (Crunch or Optimize), source (Background or Runtime), before/after row counts, file consolidation, and status. Click a row to open the Spark History Server detail panel for the underlying execution. |
| Metadata Collection | Table showing metadata collection runs — the lightweight discovery scans that identify which partitions are candidates for crunching. |
Filters and search
Use the filter bar to narrow results by time window, version, table type, or bucket. Type in the Search table name box to filter all tabs to a specific table. Filters persist across tab switches within the Activities page.
Data Management
URL: /reports/data-management
The Data Management report is a weekly executive summary that tracks your organization's optimization goals, quarter-to-date progress, ROI, and the universe of tables eligible for optimization. It can be previewed and sent as a weekly email report.
Quarter-to-date progress
If a quarterly goal (in PB) is configured in Platform Configuration, a progress bar shows how much of the goal has been achieved so far this quarter.
KPI cards
| Metric | Description |
|---|---|
| Tables Crunched (QTD) | Number of distinct tables processed since the start of the current quarter |
| Bytes Crunched (QTD) | Total data volume processed quarter-to-date |
| Optimization Tables | Number of tables currently available for optimization |
| Forecasted Savings | Projected annual storage cost savings based on current DRR and storage cost settings |
Charts and breakdowns
| Section | Description |
|---|---|
| Tables & Bytes Crunched | Time-series chart tracking cumulative quarter-to-date volume |
| ROI Metrics | Return-on-investment breakdown: gross storage savings, operational cost estimate, and net savings |
| Optimization Opportunities | Table-level breakdown of eligible tables, their size, and forecasted annual savings if onboarded |
Cloud Savings
URL: /reports/cloud-savings
The Cloud Savings report quantifies the dollar value of storage savings Granica has delivered and projects future savings over your chosen time horizon. Storage cost and discount rates are configured in Platform Configuration.
KPI cards
| Metric | Description |
|---|---|
| Data Processed | Total pre-crunch data volume — the baseline that savings are measured against |
| Total Saved | Total storage volume eliminated across all time |
| DRR | Cumulative Data Reduction Ratio |
| Current Month | Dollar savings accrued in the current calendar month |
| Operational Cost | Heuristic estimate of Granica's processing cost per PB (until direct cloud billing integration is available) |
| Net Savings | Total savings minus estimated operational cost |
Projection period
Select a projection window of 3, 6, 12, or 24 months. Granica extrapolates savings forward from the current DRR and your configured storage rate, marking projected months visually in the Monthly Savings chart.
Charts and breakdowns
| Section | Description |
|---|---|
| Monthly Savings | Bar chart showing actual savings per month with projected months shown in a lighter color |
| Savings by Table | Per-table breakdown of total storage saved and the DRR for each table |
| How Savings Are Calculated | Expandable explanation of the savings formula and what the projection assumes |
Email reports
The Platform Status and Data Management reports can each be sent as scheduled emails to specific recipients or to all users by role. Configure recipients and the email theme under Platform Configuration → Email Reports.
| Report | Frequency | Default recipients |
|---|---|---|
| Platform Status | Daily | All Editor and Admin users |
| Data Management | Weekly | All users (Viewer, Editor, Admin) |
Each report page has a Preview Email button to review the email layout before it goes out.
Manage Users
Add, edit, and manage user accounts and roles in the Granica Console.
Configure Crunch
System-wide platform settings that control how Granica Crunch operates, calculates savings, and communicates with your team.