Configure Lakehouse Safety for Databricks
Learn how to integrate Granica Screen with Databricks for safer analytics, ML and AI
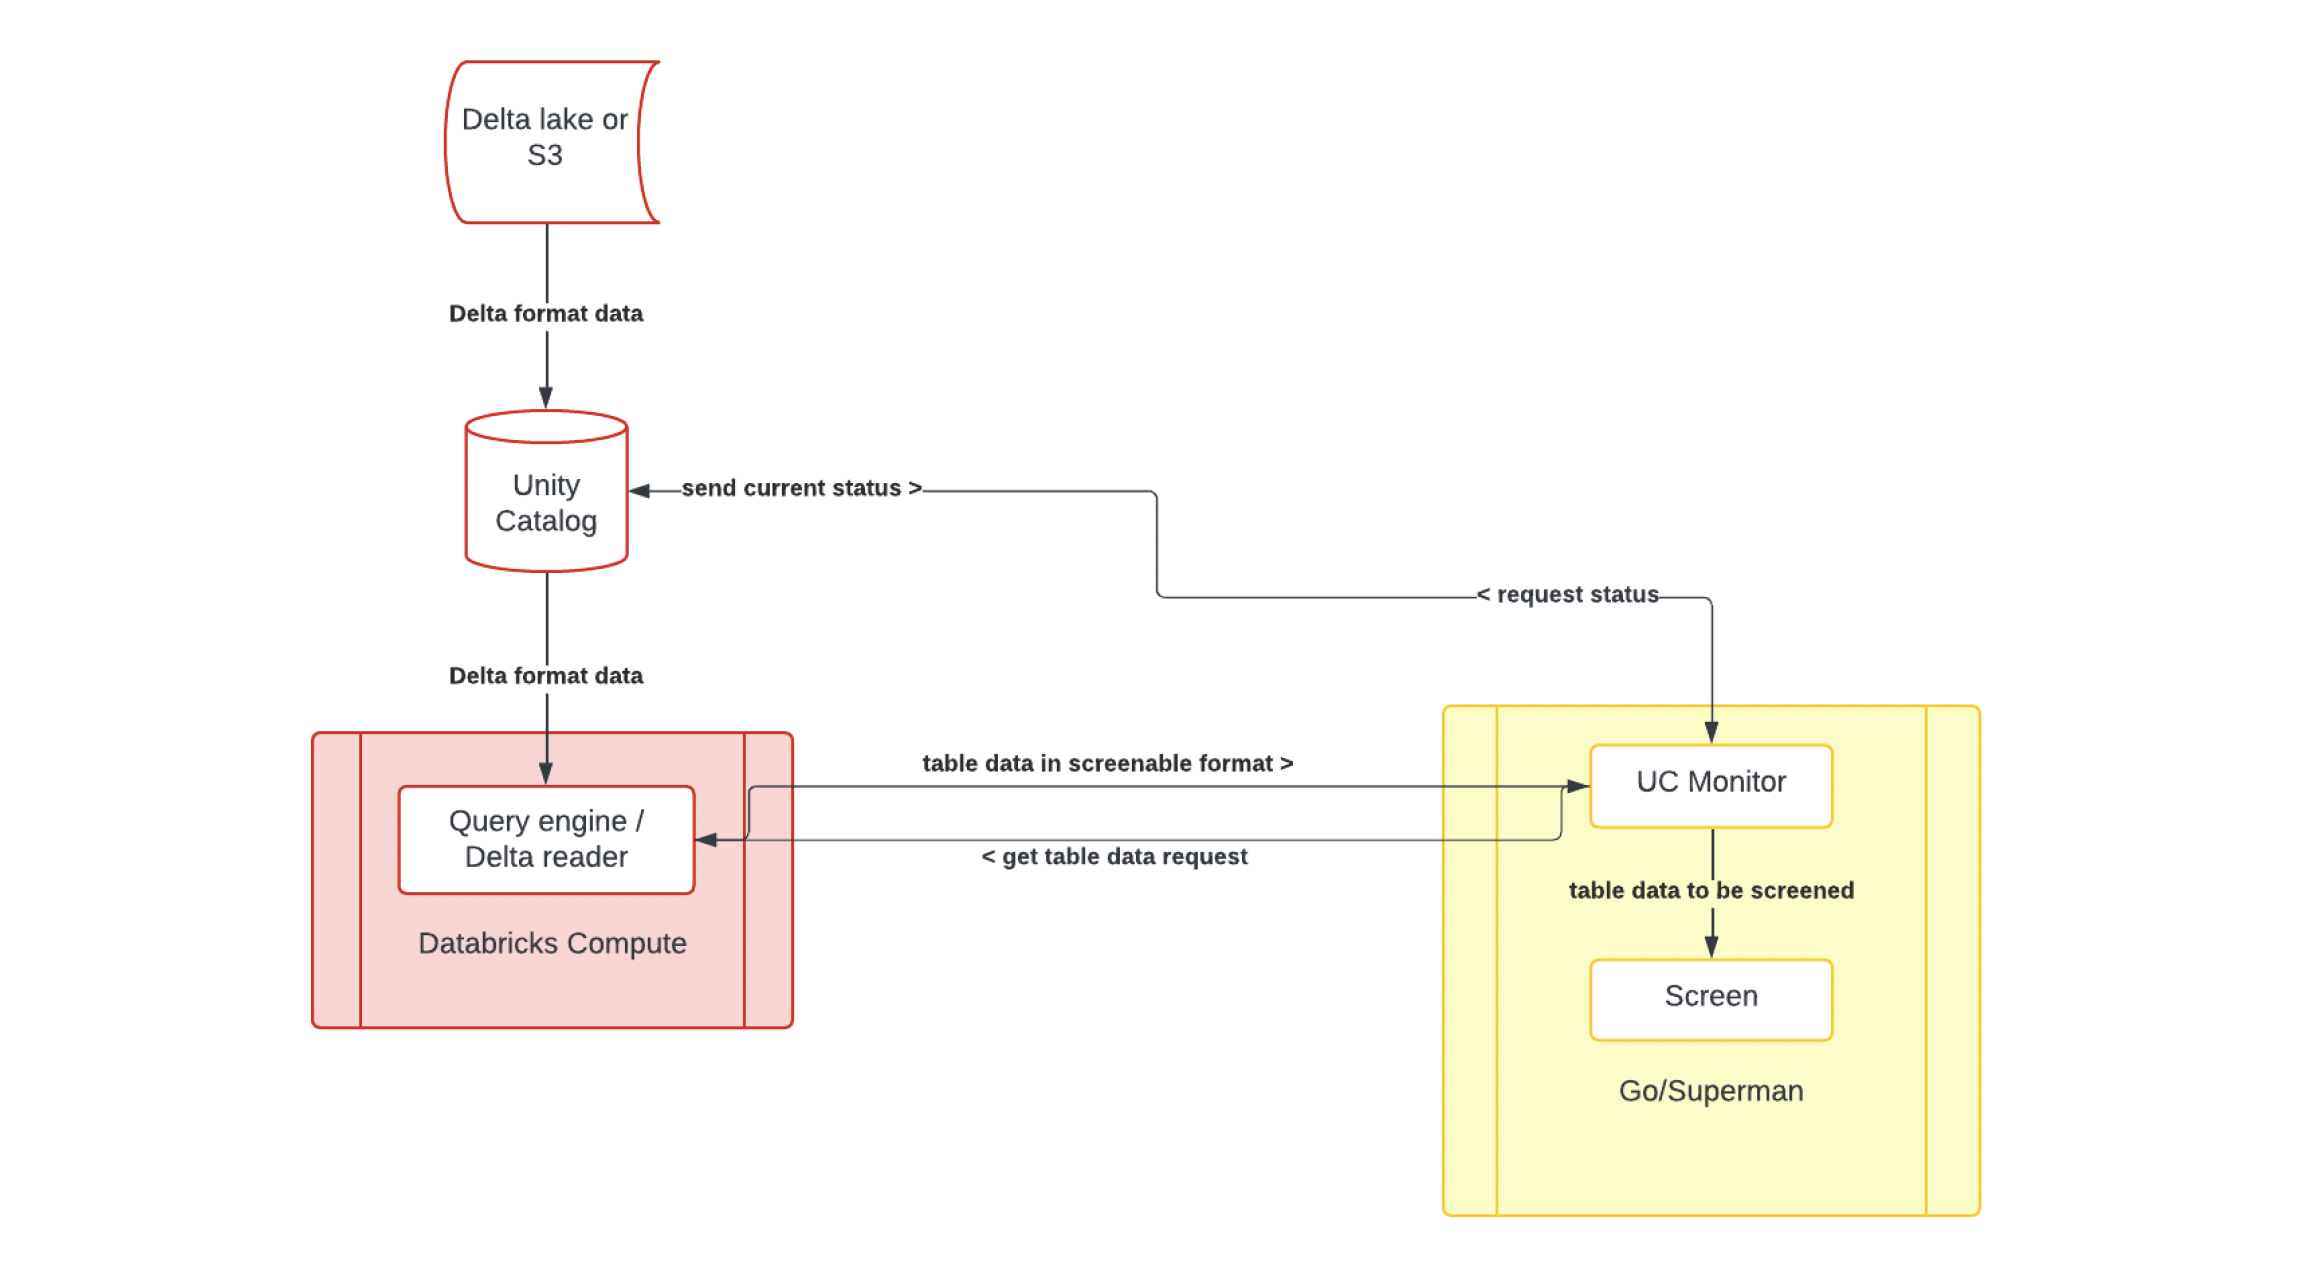
Granica Screen is deployed as a managed Kubernetes cluster within customer cloud infrastructure on AWS and GCP, with support for Azure coming soon. This enables Granica to process customer data without data leaving the customer-managed environment. Granica manages updates, scaling, and monitoring of the deployed infrastructure.
Screen’s users are typically data infrastructure or platform engineers who interact with the Kubernetes cluster either directly or through the Granica CLI.
Specifically:
- The Granica cluster is configured through the Granica CLI with credentials for a storage provider and a policy configuration specifying which assets to scan.
- Screen automatically scans new and existing assets matching the policy configuration via batch processing and publishes reports of scan findings to a configured location in cloud storage or a Databricks table.
Databricks integration basics
Screen integrates with Databricks through the following touchpoints:
- Unity Catalog API to scan for catalogs, schemas, or tables to scan (via Go SDK).
- Databricks SQL Driver for Go to read table data for scanning.
- Databricks SQL Driver for Go to write detection results to a UC table.
Other integration details:
- Screen authenticates using a designated Granica service principal configured with permissions to read tables to be scanned, and write to the designated result location.
- The user-agent string is
granica-screen/<version>.
The detailed customer steps for configuring the Databricks integration are included in the next section.
Databricks integration - customer process
1. Create service principal and auth configuration
Create a service principal for Granica to access your Unity Catalog. Ensure the principal access to all of the following:
- Databricks SQL access
- Workspace access
- Allow cluster creation (needed only if creating warehouse automatically in next step)
Once the account is created, follow the instructions provided by Databricks to create a .databrickscfg file:
- Option 1 (recommended): Set up and use a service principal to authenticate with Databricks via OAuth M2M.
Example .databrickscfg file:
Note that the client_secret cannot be accessed again after it is initially created, so be sure to note it down before moving on.
- Option 2: Manually generate and maintain personal access token.
- Note that this currently requires using the Databricks CLI
Example .databrickscfg file:
2. Grant compute permissions
Granica uses Databricks compute to read data, and we recommend configuring with a dedicated SQL warehouse
- Option 1: (recommended): Granica automatically creates and manages SQL warehouse
- Grant SQL Warehouse creation permissions to our service principal (see previous step)
- Option 2: Manually create a SQL warehouse and grant Granica access.
- Create a SQL warehouse named
granica-screenin your workspace. - Give our account access to your SQL Warehouse ("can use")
- Create a SQL warehouse named
If you want us to automatically create a SQL Warehouse for you, you will need to Mack
For information about updating SQL permissions, including SQL warehouse, see this page.
3. Grant Unity Catalog permissions
Read access
Granica requires read access to tables designated for scanning.
In order to grant these permissions, go to your Unity Catalog, select the entity you want to grant permissions for, select the Permissions tab, and click Grant. Then, select the Granica service principal and check all of the permissions you would like to grant.
For any catalog/schema/table to scan, the following permission are needed:
- SELECT [CATALOG|SCHEMA|TABLE]
- USE [CATALOG|SCHEMA] (for all parent catalogs/schemas)
Write access
In addition, if Granica Screen is configured to write reports of discovered PII to Unity Catalog, the following permissions are also needed:
- Option 1: (recommended): Granica automatically creates a catalog to store detection reports
- Catalog creation permissions (
CREATE CATALOGon metastore - use application id of service principal) - GRANT CREATE CATALOG ON METASTORE TO
53fb14a8-ddc7-486e-bb40-17aae59e8261
- Catalog creation permissions (
- Option 2: Manually create a catalog and make the Granica service principal OWNER. The name of this catalog must be configured in the Granica policy
4. Add .databrickscfg to Screen
On the Granica admin server, add the .databrickscfg file as a Kubernetes secret named databricks-config. There will already be an empty placeholder so it will need to be overwritten, for example by deleting and recreating the secret:
Then replace the contents with the contents of the .databrickscfg file created above.
5. Configure Granica policy
Granica’s policy configuration allows specification of how to scan entities and which entities to scan. The Screen configuration page outlines the various available parameters.
Here is the minimal policy:
This sample policy enables a simple scan for all tables and schemas in catalogs matching the pattern b1-* but NOT b1-eu-*
Policies can be passed using the Granica CLI.
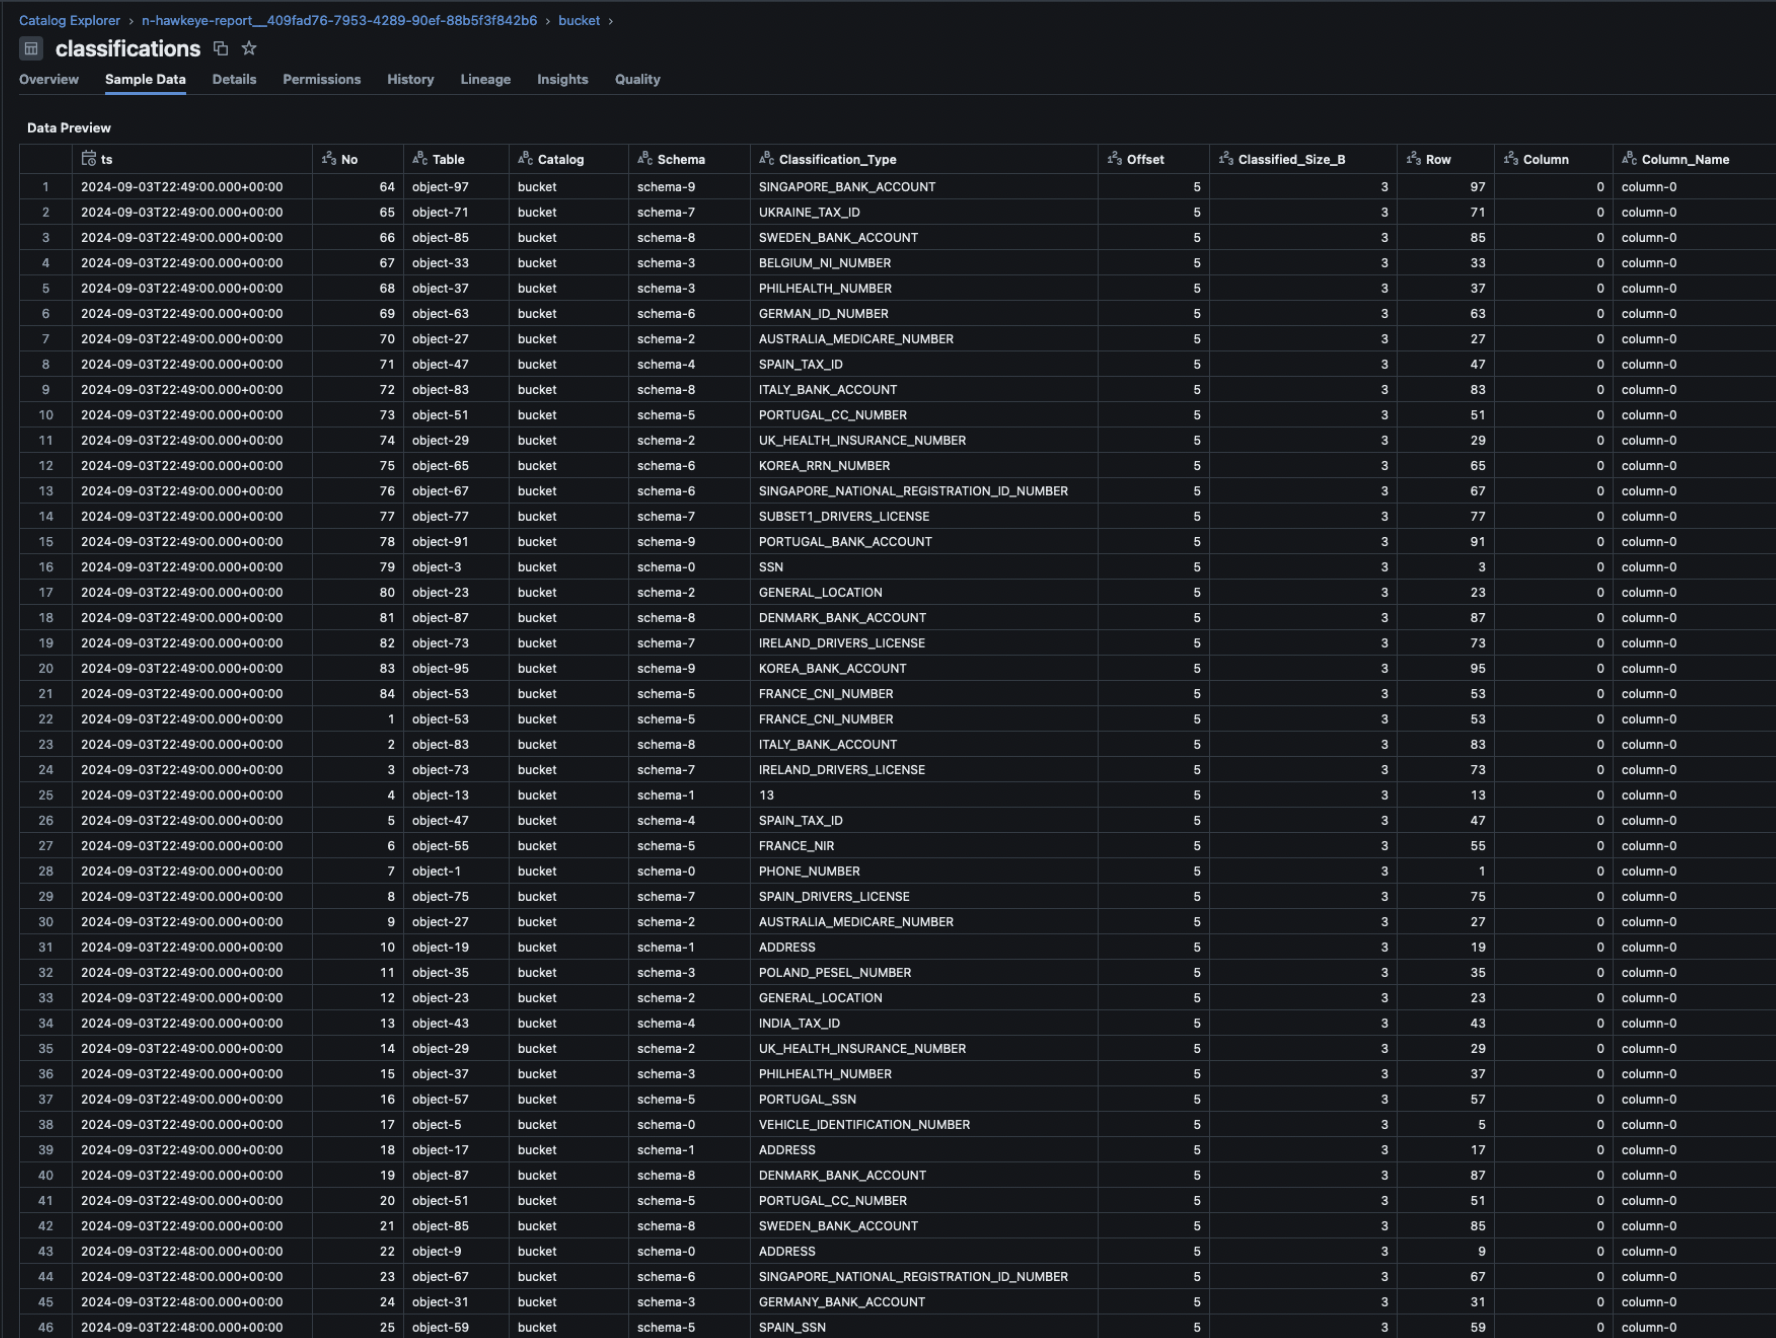
6. Consuming results
Customers can consume results as documented here. Mack - latest here? "The public documentation does not yet include specifying Databricks as a report location, but this is a new feature we are adding with the integration."
Here is an example table: