Crunch and AWS EDP
Understand how Crunch works with the Enterprise Discount Program.
If you forecast a significant amount of spend with AWS each year, across all services, it may make sense to take advantage of the AWS Enterprise Discount Program (EDP). This program offers a discount when you commit to a specific level of spend (say $85M) over a specific term (typically 3 years). Importantly:
- Any overconsumption of services beyond the EDP committed spend is simply not discounted.
- Any underconsumption of committed spend doesn’t reduce the amount you owe, and you are not allowed to rollover any underage to the next commitment term. Underconsumption is therefore to be avoided as it represents pure costs with no benefit.
Organizations using the EDP typically commit 80-90% of their forecasted spend. This way they get a discount on the majority of their spend while minimizing the risk of underconsumption if actual spend comes in less than forecasted. In such typical cases the savings from Crunch simply reduce overconsumption and have no impact on committed spend. Of course, it is much more common for organizations to spend more with AWS than forecasted given how easy it is to consume resources, in which case Crunch delivers additional savings again with no impact on committed spend.
In rare circumstances however, actual spending may come in significantly lower than forecasted, even approaching the committed spend. In such “low actuals” cases the savings from Crunch will interact with the committed spend resulting in hte value from Crunch being realized partly as repurposable savings and partly as free, net-new spending on AWS services.
In this article we show in detail how Crunch and EDP work together in both typical and “low actuals” scenarios. For each we analyze a single EDP term and then a series of three terms back-to-back. Here are the common starting assumptions for a typical organization with significant cloud spend in AWS. Keep in mind that Crunch reduces S3 storage spend, not compute spend:
- Forecasted Spend across all services: $100M
- Portion of Forecasted Spend on Amazon S3: 25%
- EDP Committed Spend: $85M
- Forecasted Commit Overage: 100 - 85 = $15M
- EDP Term length: 3 years
Typical scenario: Actuals are within +/-5% of Forecast
To be conservative we’ll assume actuals come in at the lower bound of forecasted spend. Thus the actual spend is $95M, the Commit Overage is reduced to $10M, and the Commit of course stays at $85M. Based on the $95M of actual spend Crunch delivers the following (typical) results:
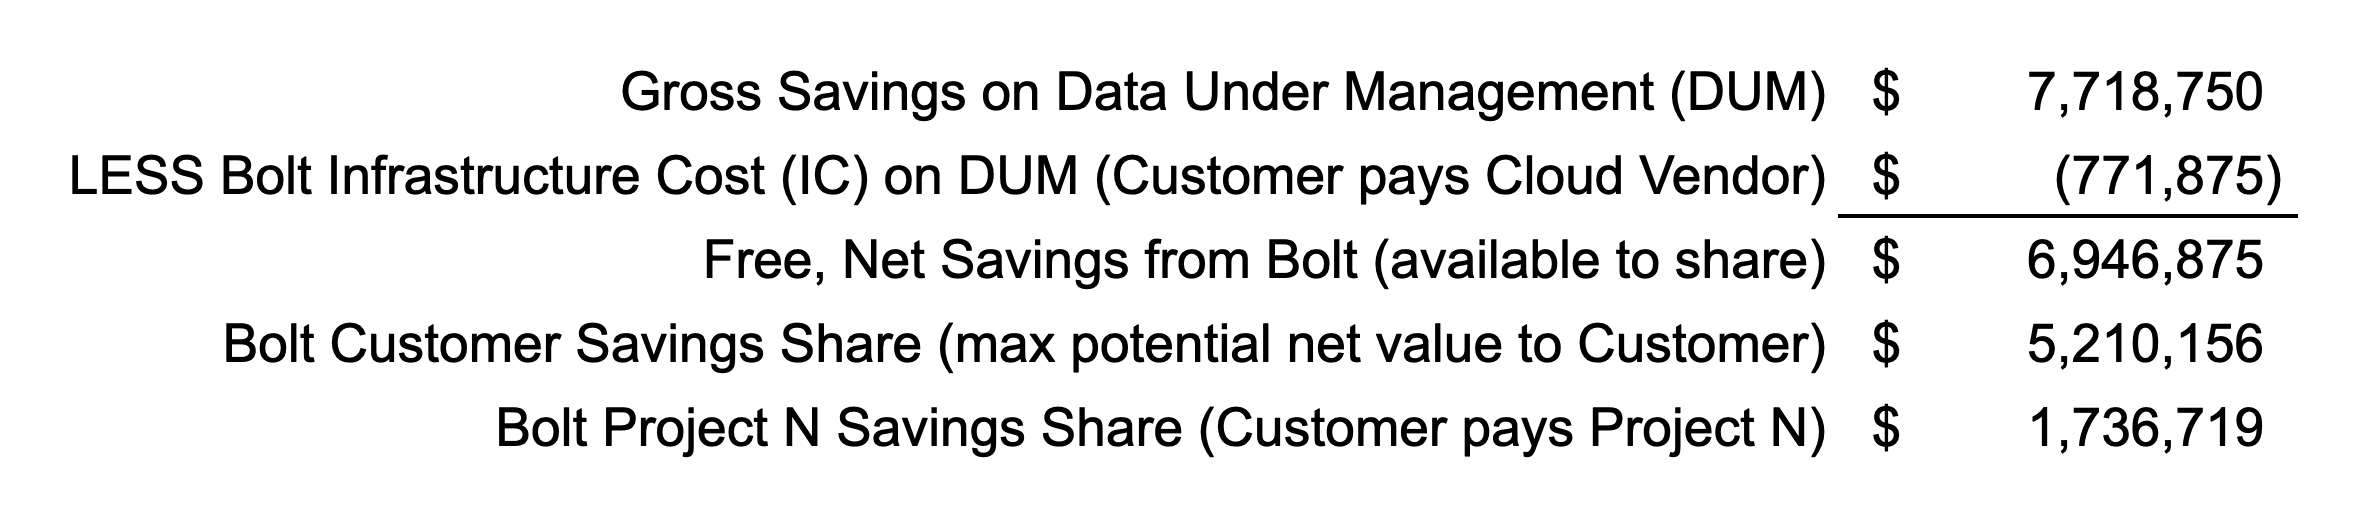
Here we see the maximum potential net value Crunch can deliver is $5,210,156.
Single EDP Term (3 Years)
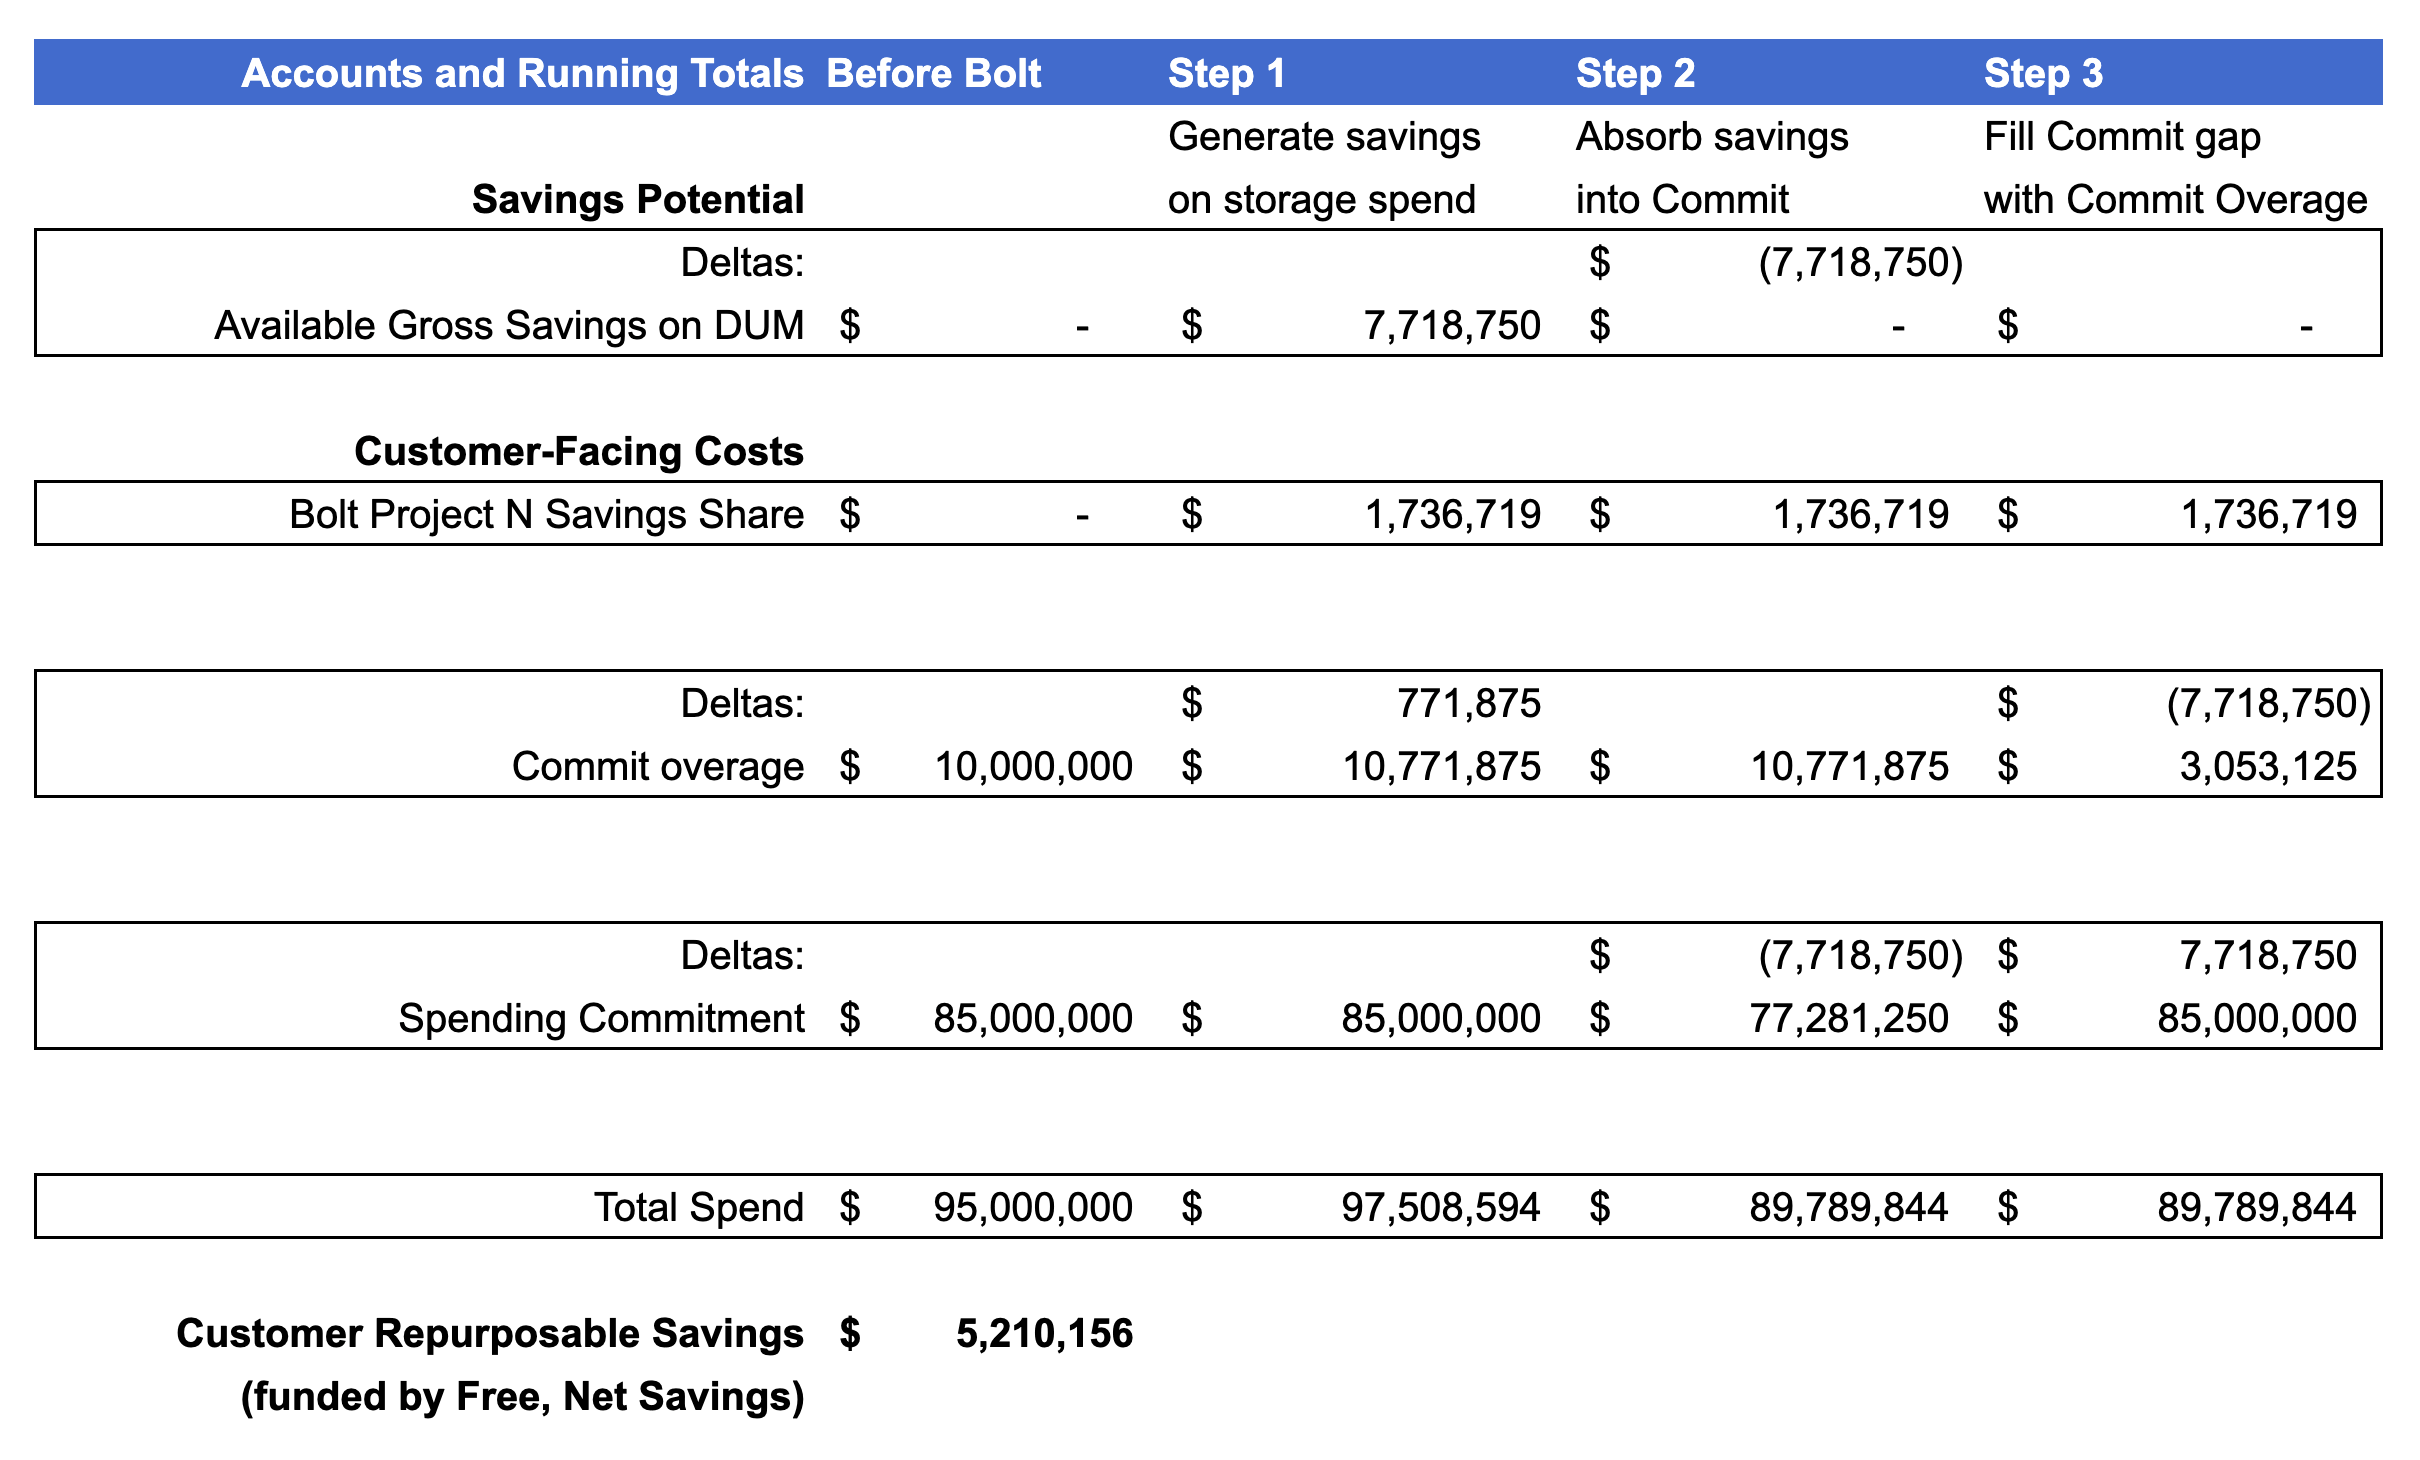
Let’s walk through how these results affect spending in a single term. We create running totals for key “accounts” and show the accounting across a series of steps. In reality, all the steps happen at once but we break them apart in this analysis to clearly illustrate what’s going on:
Table View:
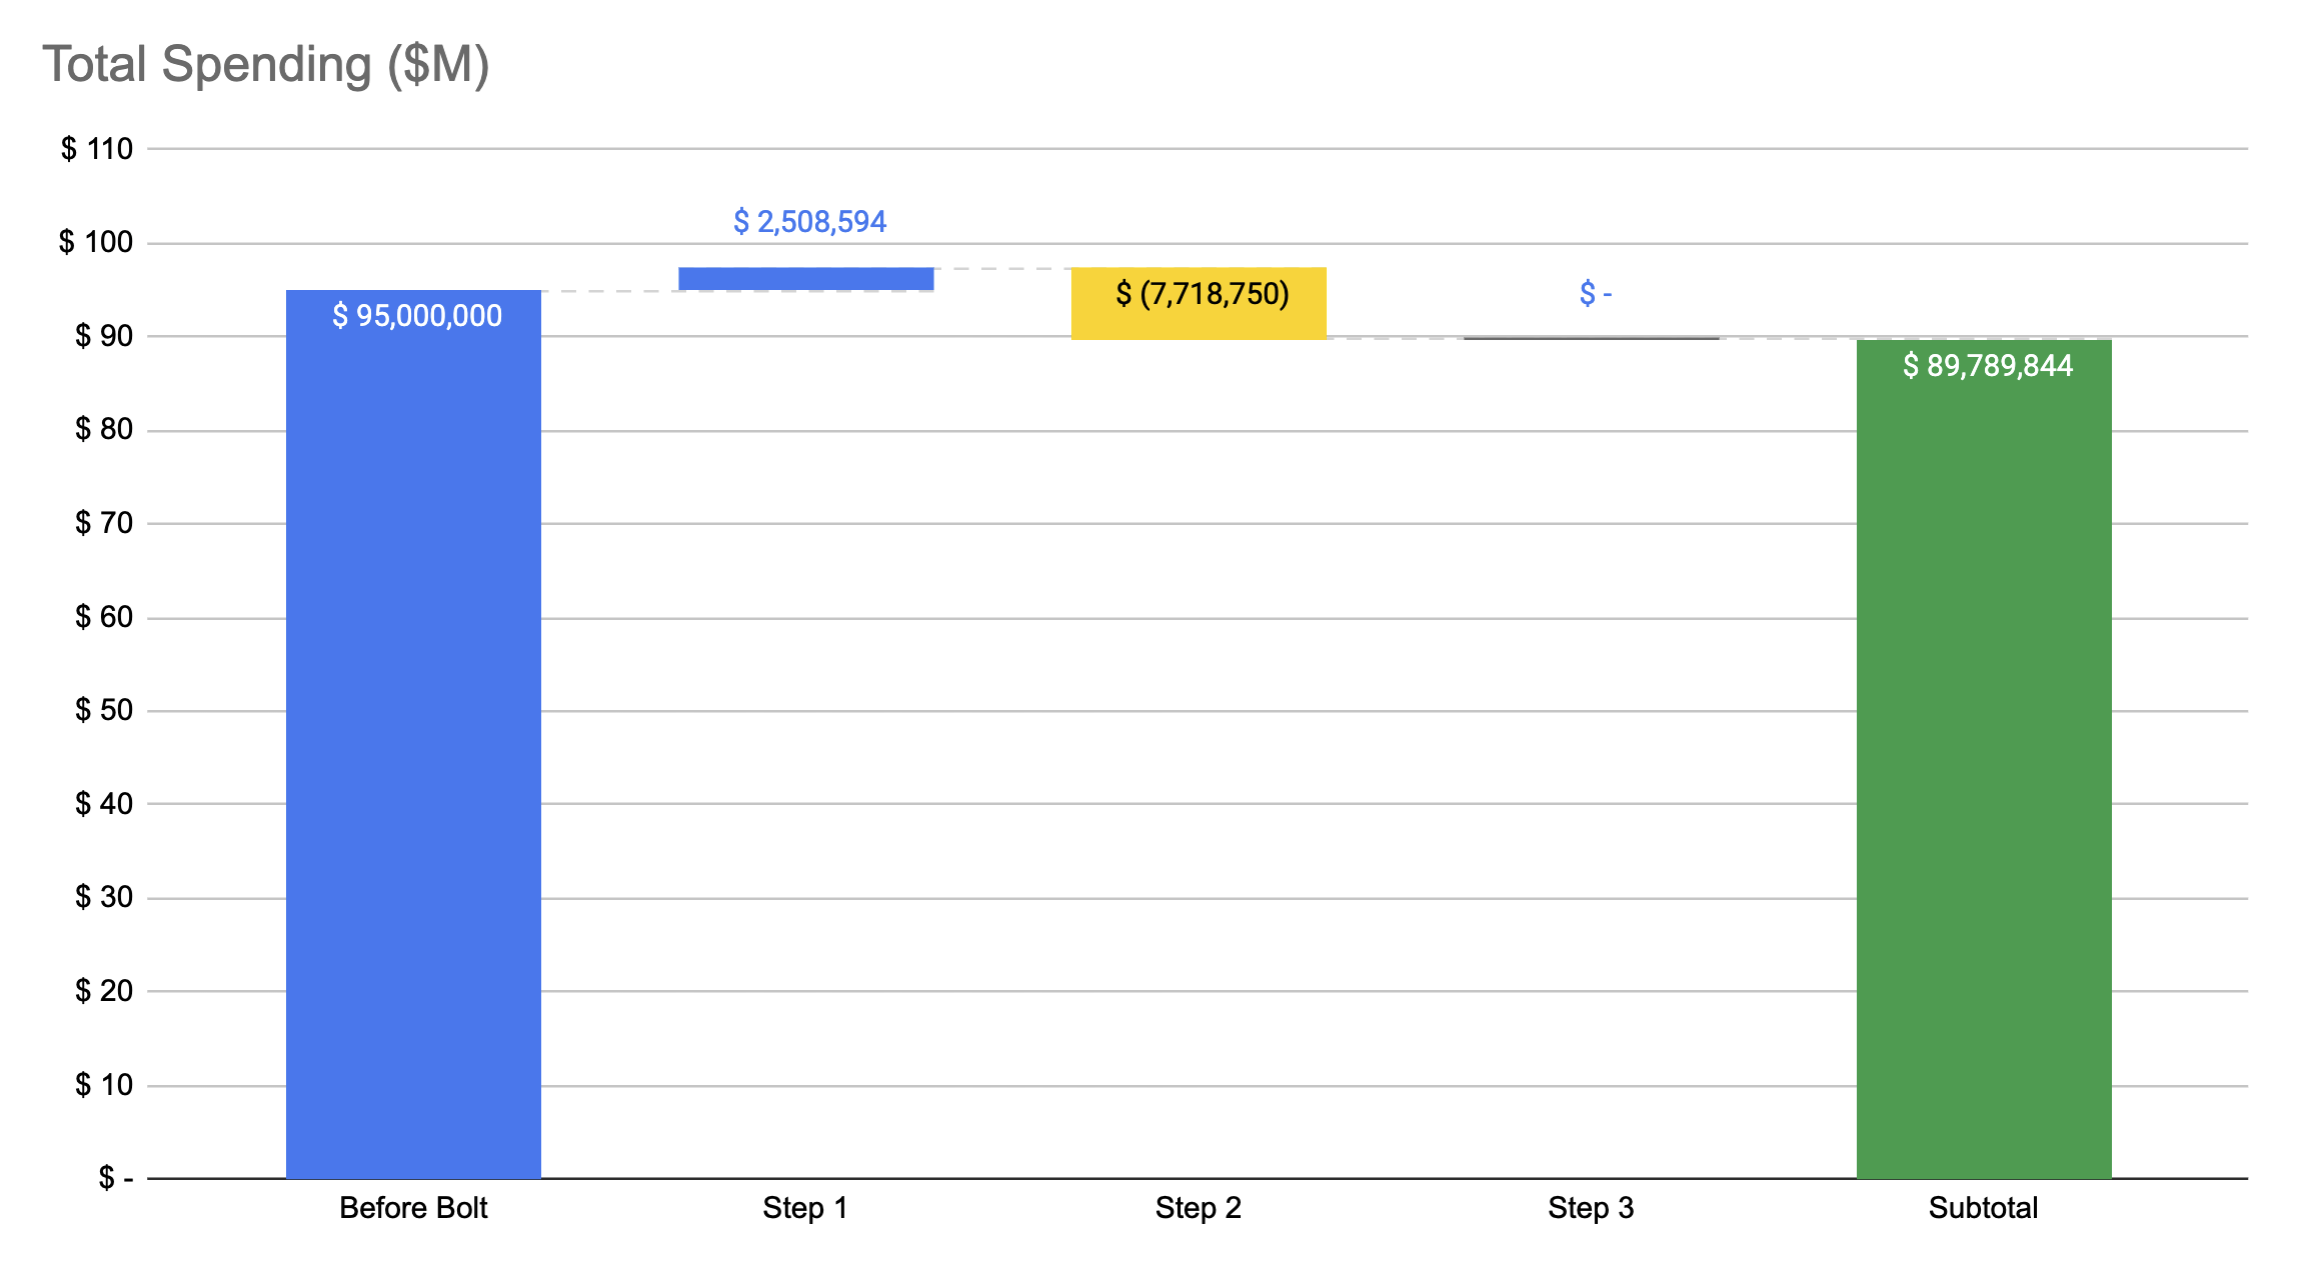
Waterfall View: (What is a waterfall chart?)
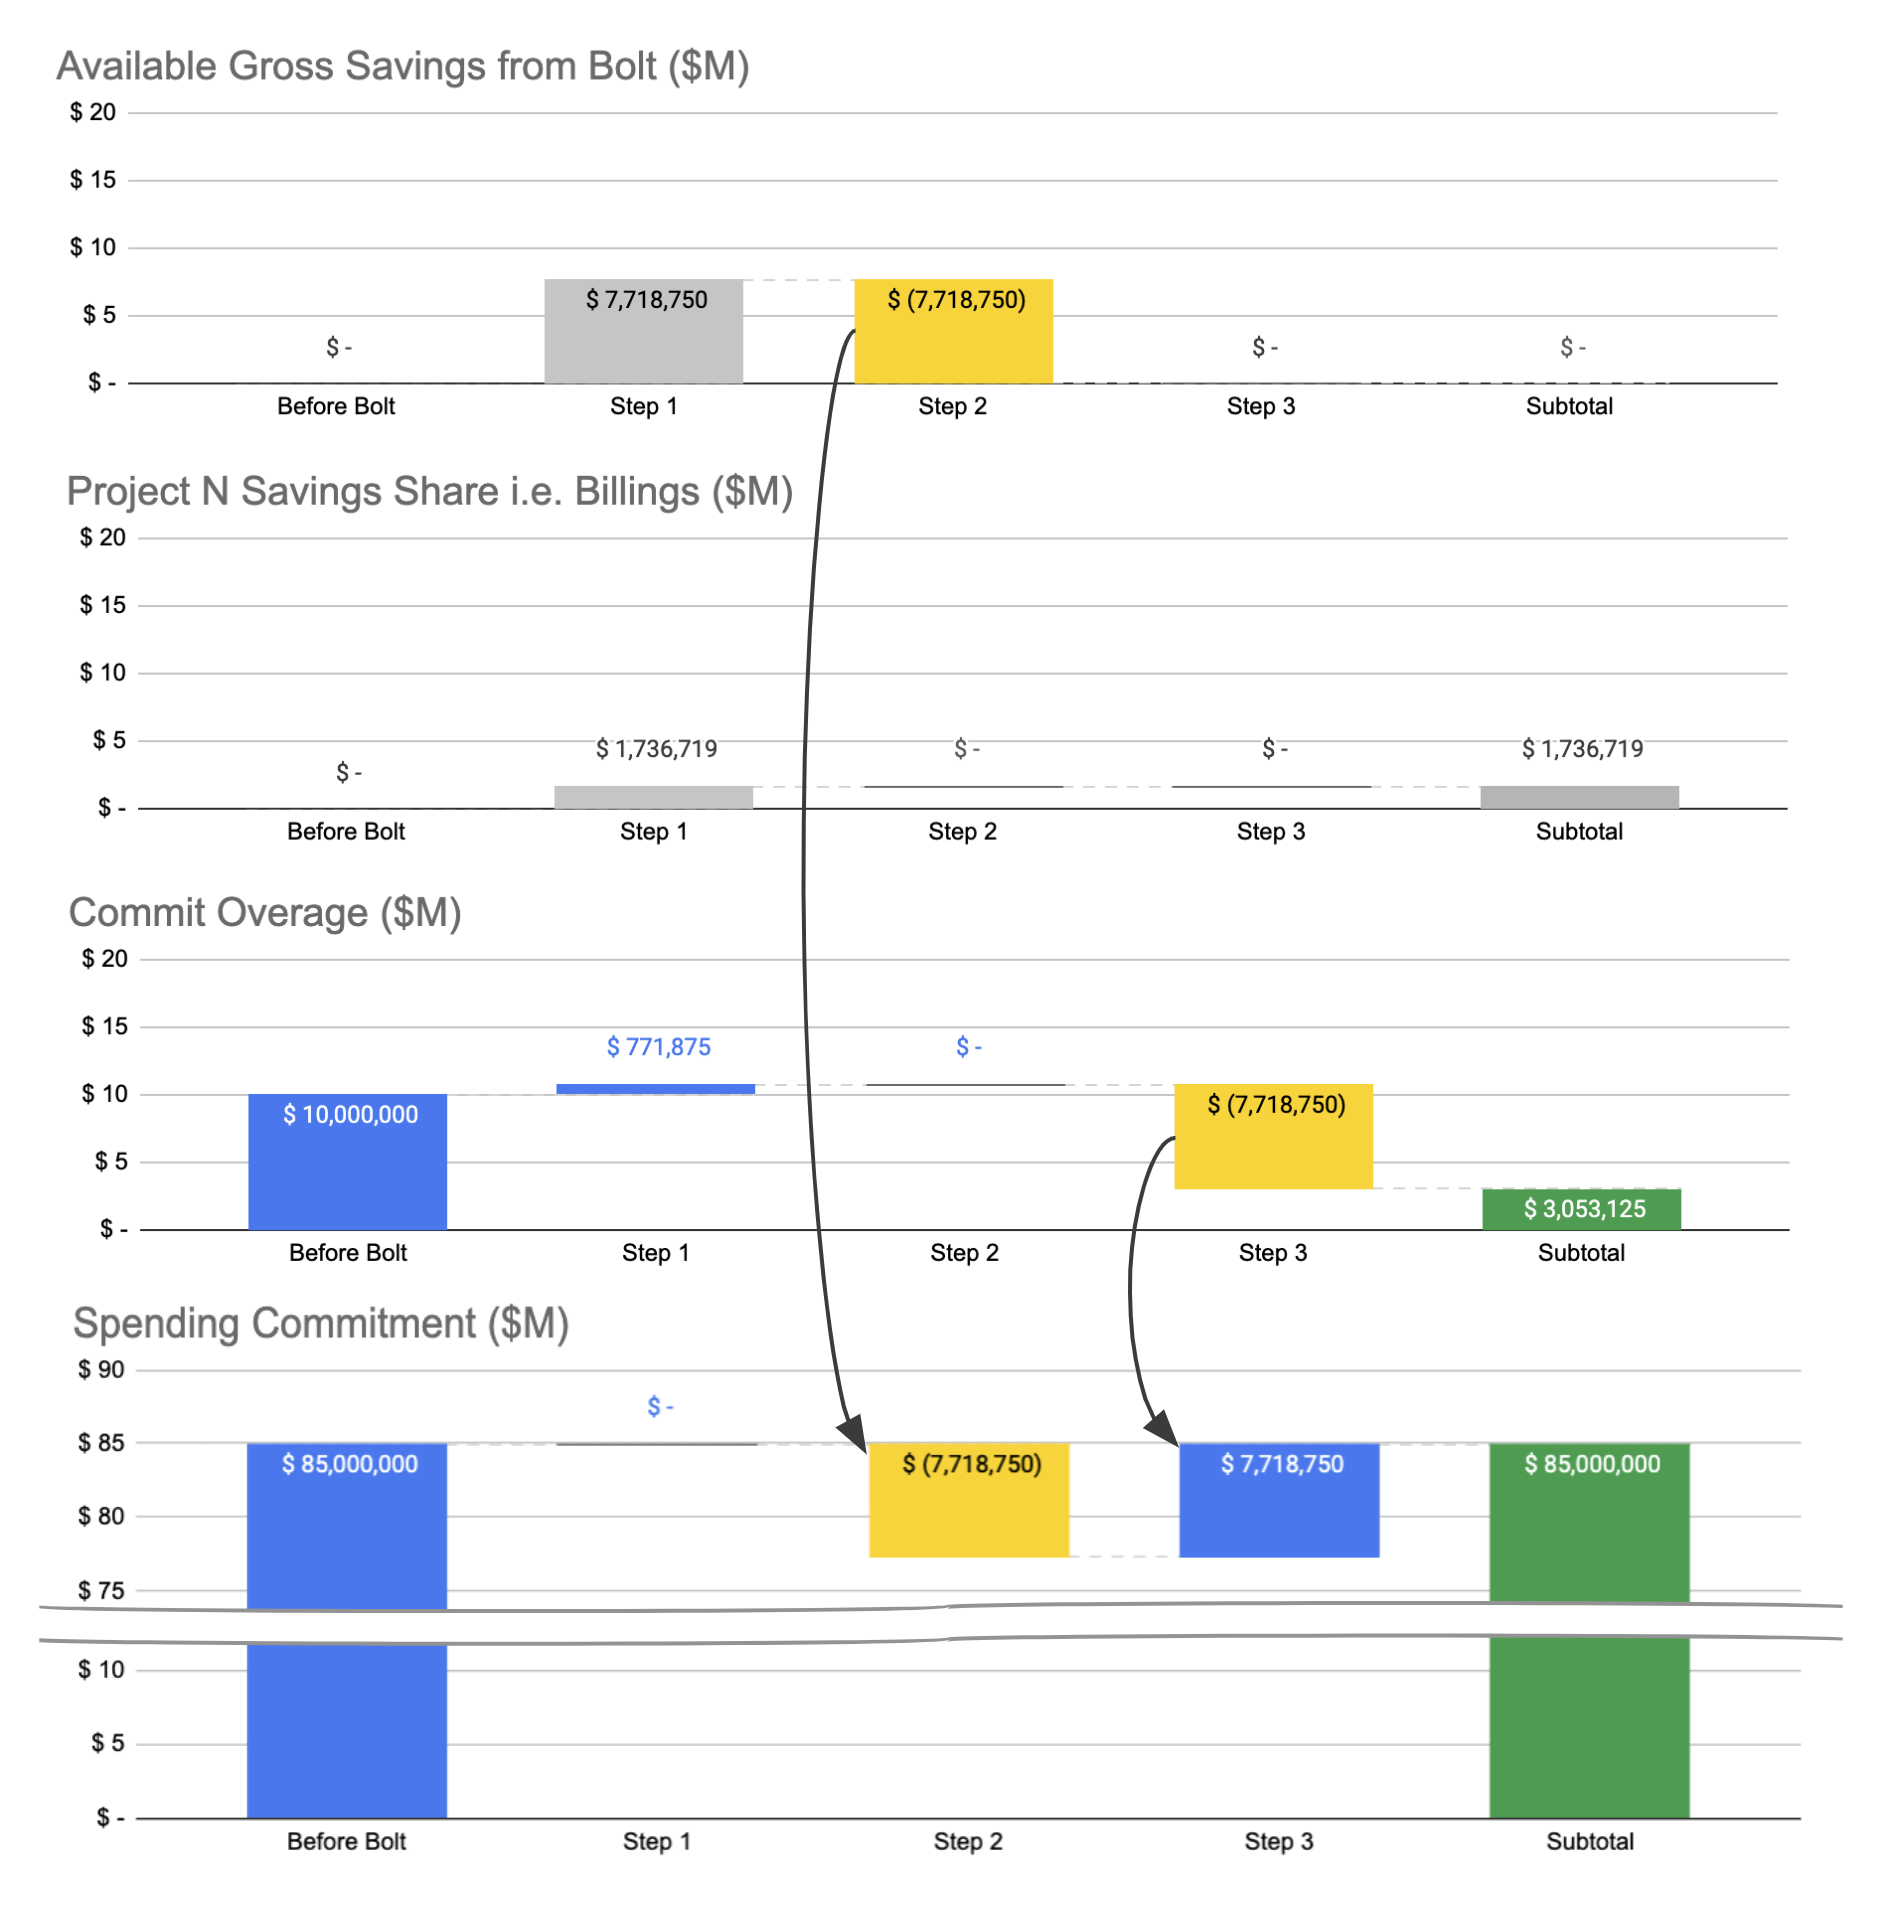
- Step 1: Crunch processes the data, generating both Gross Savings and infrastructure costs. In this step, infrastructure costs go temporarily to the Commit Overage, and Granica collects our Savings Share based on the free, net generated savings.
- Step 2: We “spend” the entirety of the available Gross Savings by applying it to the Spending Commitment. The effect is to create a gap in the Commit.
- Step 3: Finally, we fill the Commit gap using a portion of the available Commit Overage. The end result is that total spending is reduced with no change to committed spending.
Putting this all together we see that total spending has been reduced by $5,210,156, in other words 100% of the potential value from Crunch has been realized as repurposable savings. Also keep in mind that 100% of Granica billings have already been funded by the savings Crunch generated.
Three Consecutive EDP Terms (9 Years)
The following table illustrates spending and savings across three consecutive terms. For simplicity we assume that in both Terms 2 and 3 there is no change to the amount of underlying consumption represented by the spend. Said another way, in each term we expect $95M worth of underlying pre-Crunch consumption regardless of the reduced cost after Crunch.
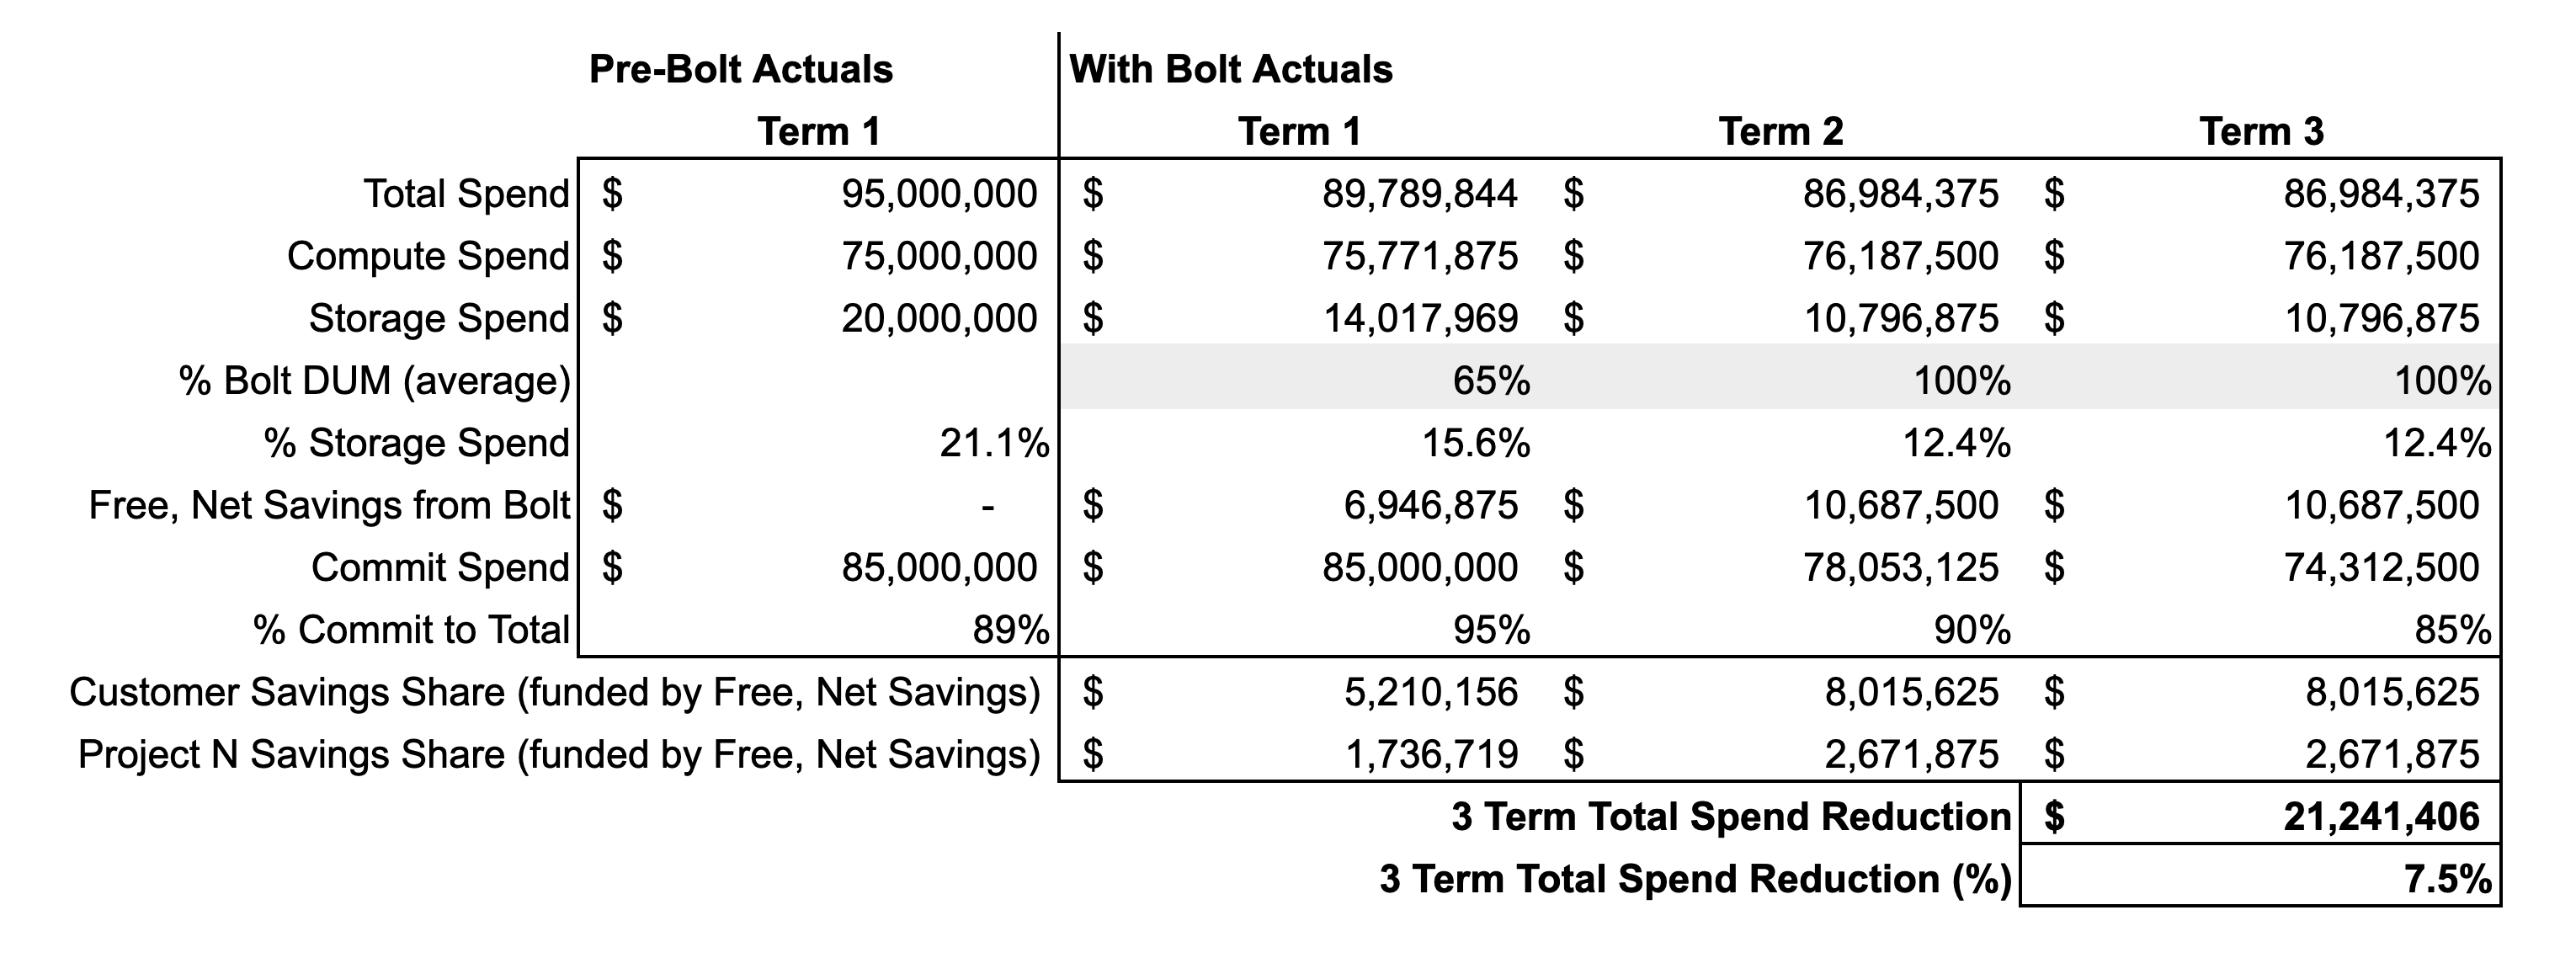
The Term 1 actuals (with Crunch) summarize the results we analyzed in the previous section. There are two changes as we move from Term 1 into Term 2:
- We increase the % Crunch DUM (average) to 100%. This is because by the end of Term 1 all data associated with the spend will be under management and reduced by Crunch. For Term 2 (and beyond) Crunch is generating the maximum possible savings.
- We decrease the EDP Commit Spend by the Free, Net Savings generated in Term 1. This is because we now expect to save (at least!) that amount in Term 2, and we want to replenish the buffer between forecast and commit in case there is significant underconsumption in Term 2.
These changes result in:
- A slightly increased Compute Spend since Crunch is reducing more data than previously.
- Significantly lower Storage Spend again since Crunch is reducing more data than previously.
- Significantly greater Free, Net Savings, again due to Crunch reducing more data.
- A lowered Commit Spend, and thus a % Commit to Total that is close to the Pre-Crunch Actuals.
- Both parties receive greater Savings Shares
As we move from Term 2 into Term 3 we once again reduce the EDP Commit Spend by the incremental change in Free, Net Savings from Term 2. This change results in a % Commit to Total roughly equal to the initial buffer based on the original expected $100M forecast and $85M commit.
All-in the organization saves ~$21M, or 7.5%, of total spend across the three terms. These savings are available for any use, whether to fund more projects (and their associated people and infrastructure) or to repurpose into other areas of the company.
Low Actuals scenario: Actuals are close to Committed Spending
Here we assume actuals come in much lower than expected at only $88M, i.e. very close to the $85M in committed spend. As a result our Gross Savings and Savings Shares scale down given the lower actual spend and we see the maximum potential net value Crunch can deliver is $4,826,250:
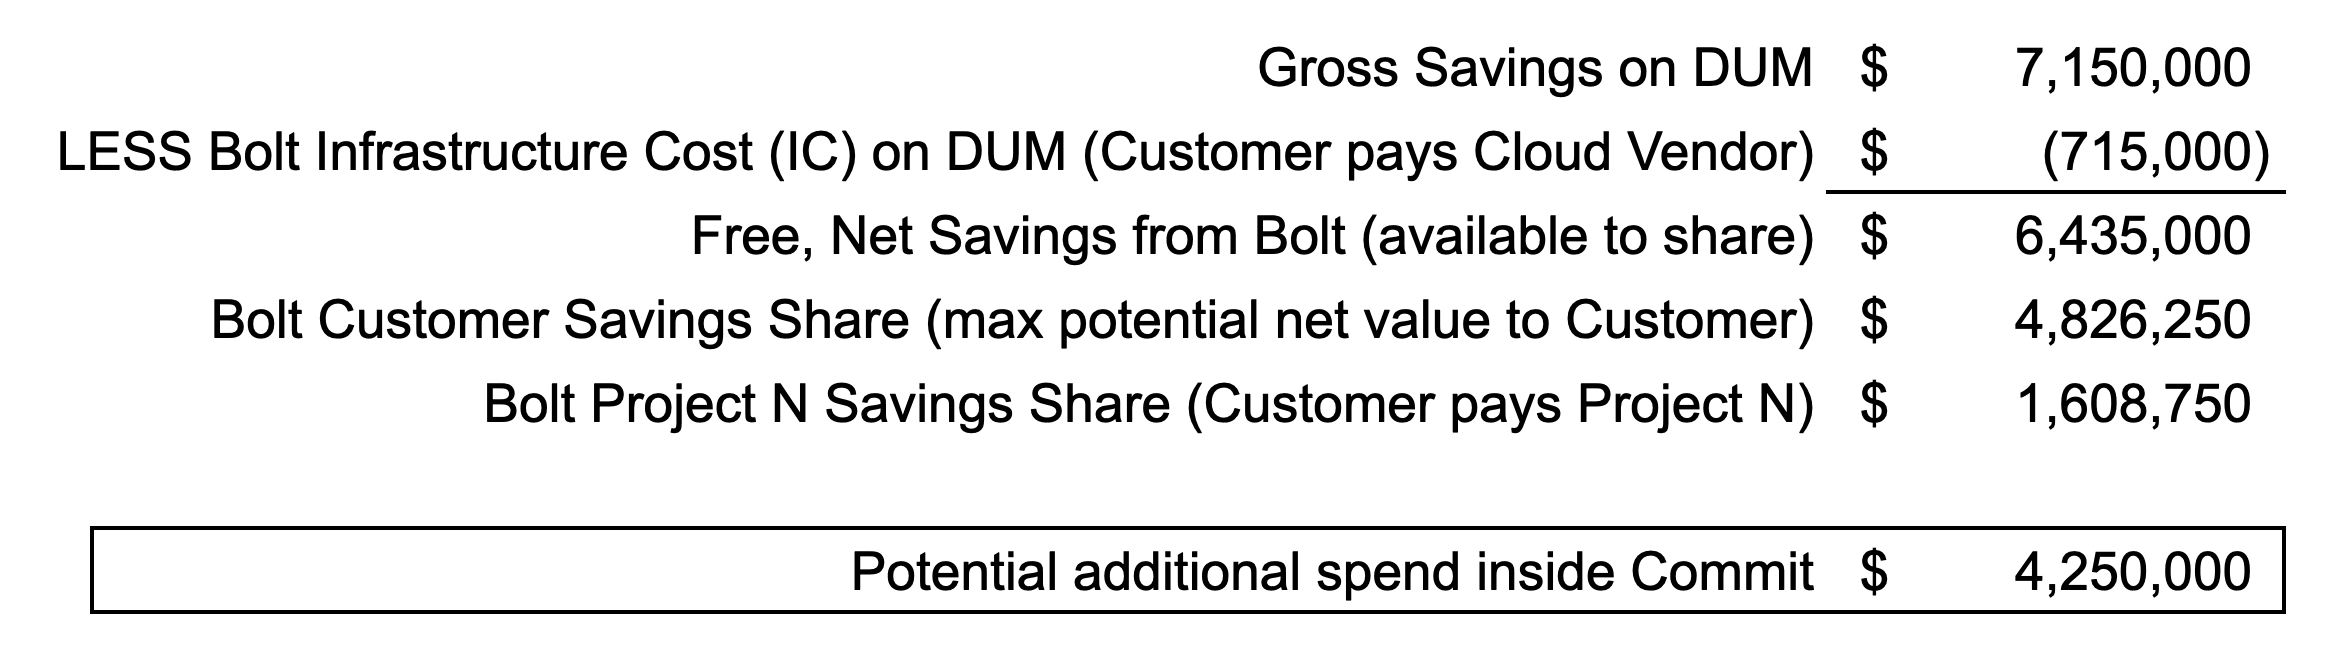
As we will show, this scenario involves interaction with the committed level of spend. Some of the Crunch potential value is realized as repurposable savings and some can be realized as funded, net-new AWS spending inside Commit. This free, net-new funding is “use-it-or-lose-it”. This of course requires the organization to be able to increase their spending given this new funding opportunity through some combination of scaling existing projects and starting new ones. For our analysis, we assume the organization can find a way to increase their cloud spend by at least 5% above the $85M Commit level, or $4.25M.
Single EDP Term (3 Years)
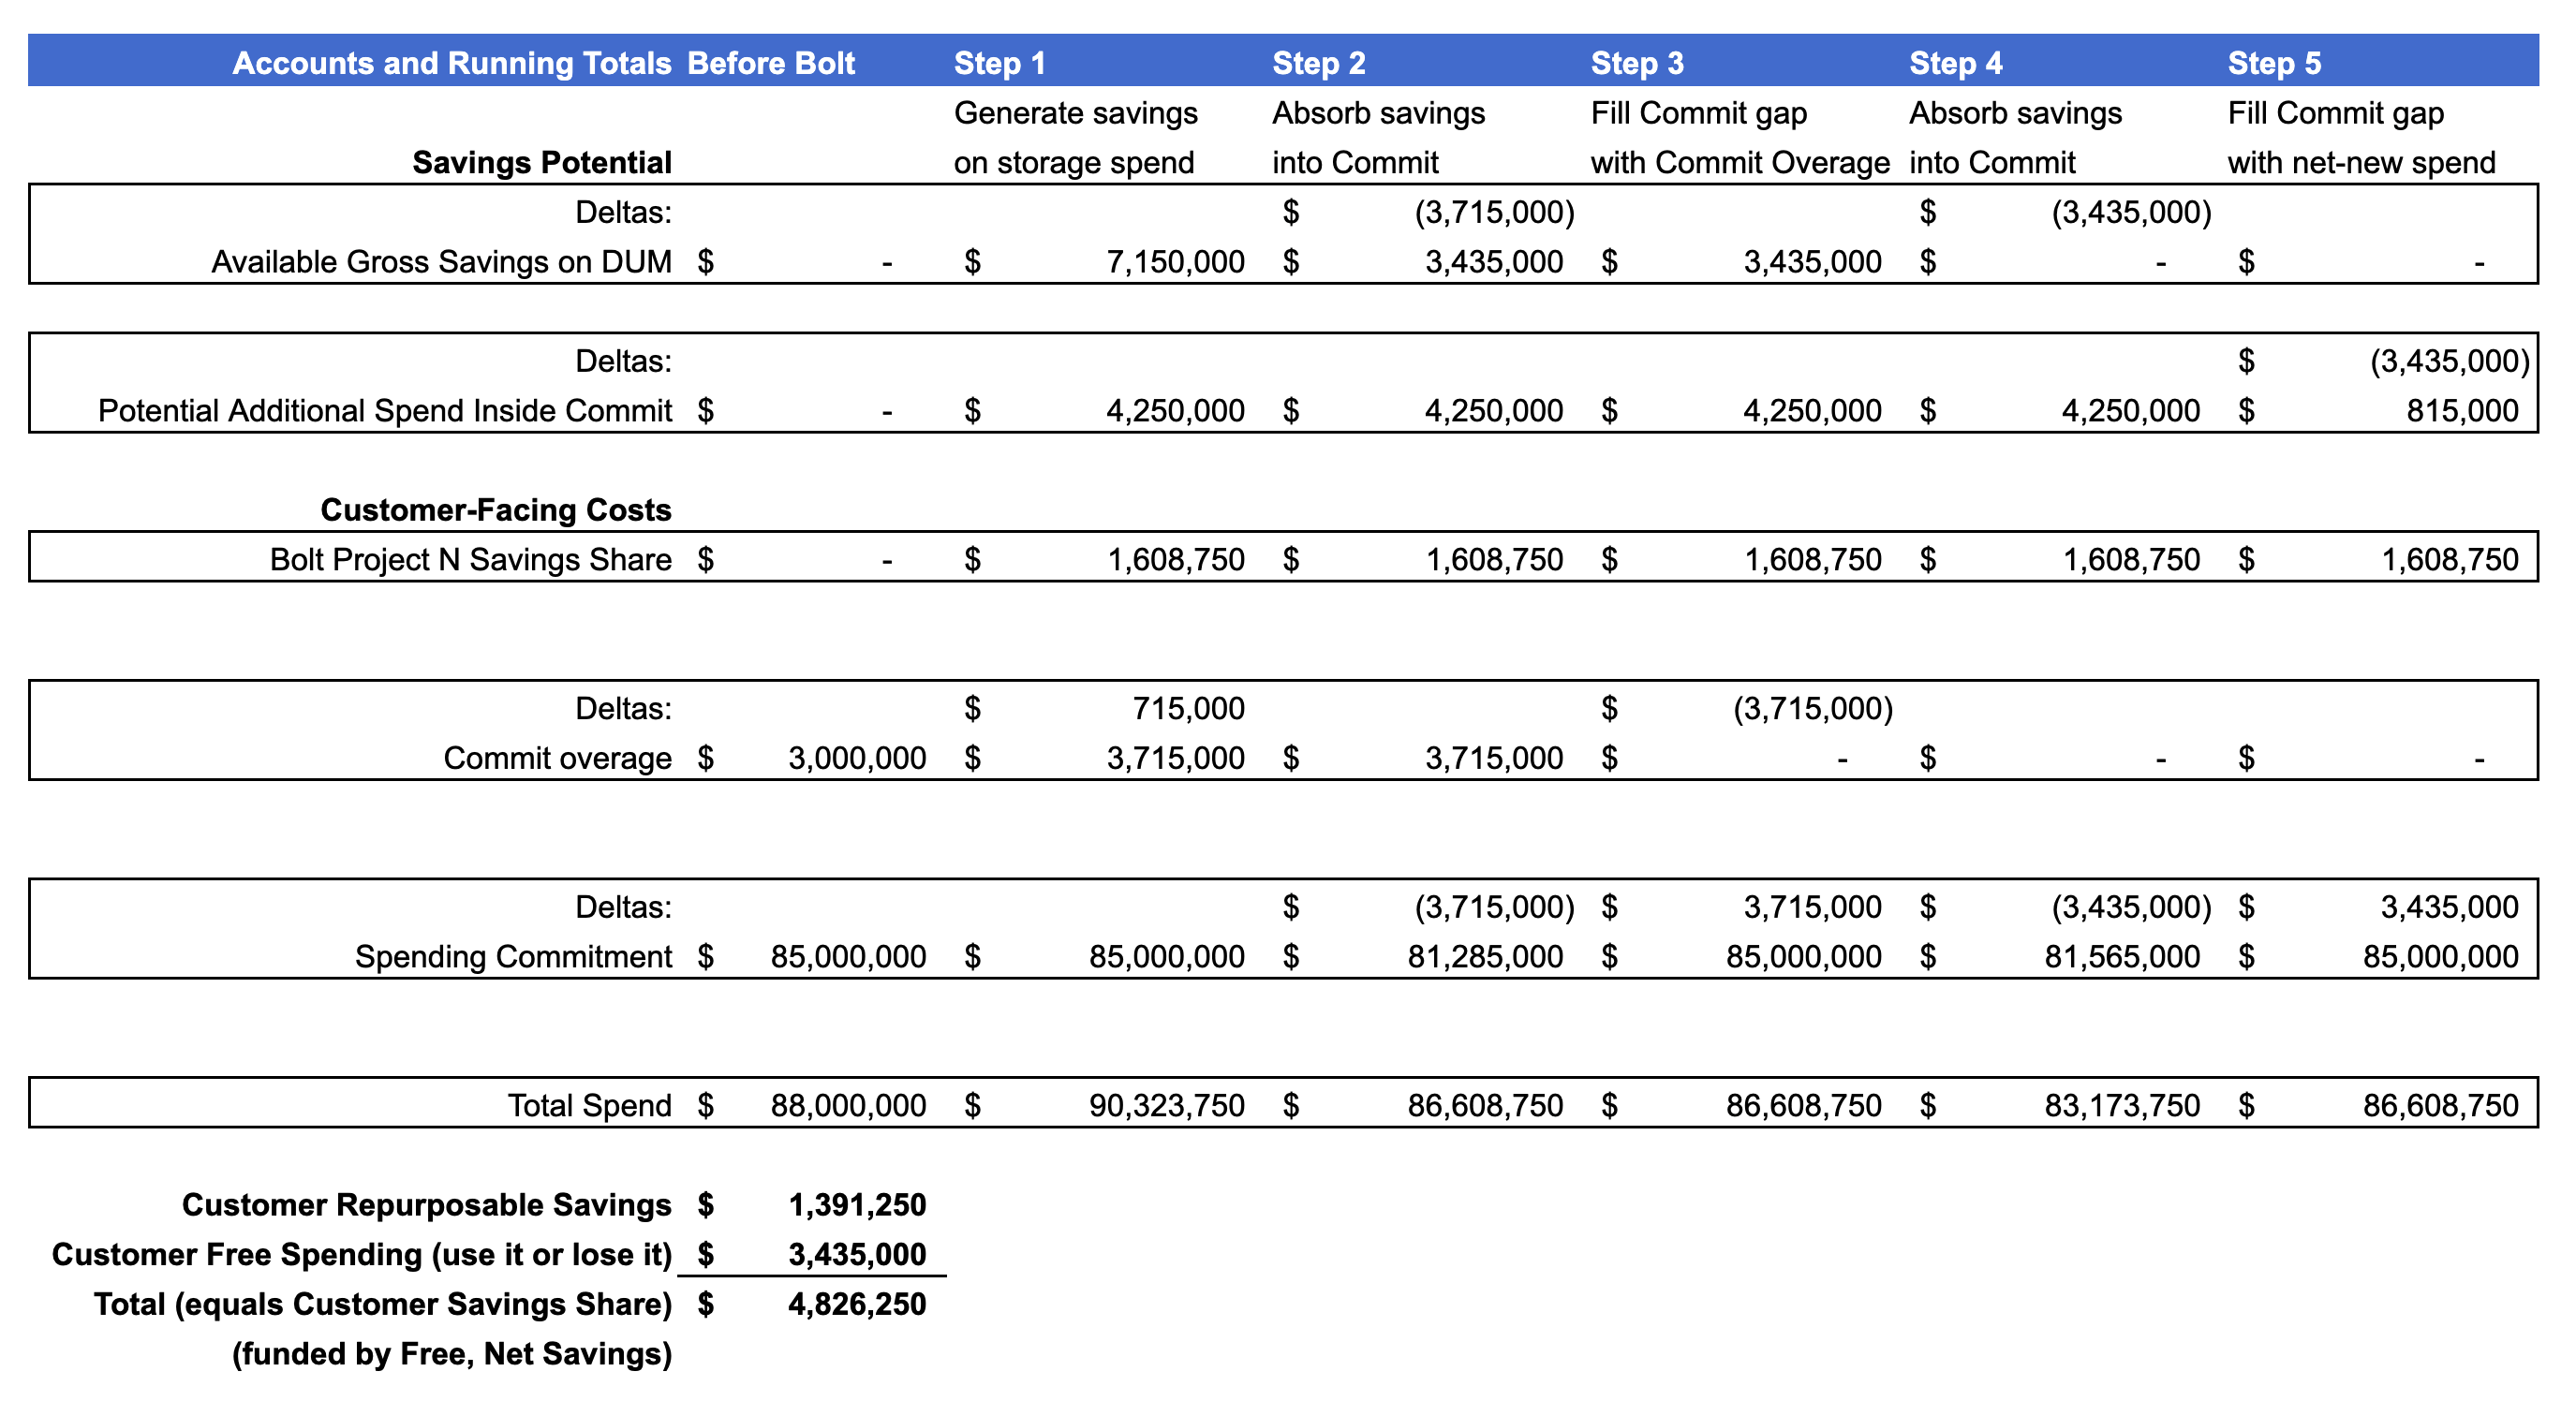
We once again create running totals for key “accounts” and show the accounting across a series of steps. This time we create a new account to track the Potential Additional Spend Inside Commit, which starts at $4.25M. We also create two new Steps associated with that account. Here’s how it looks:
Table View:
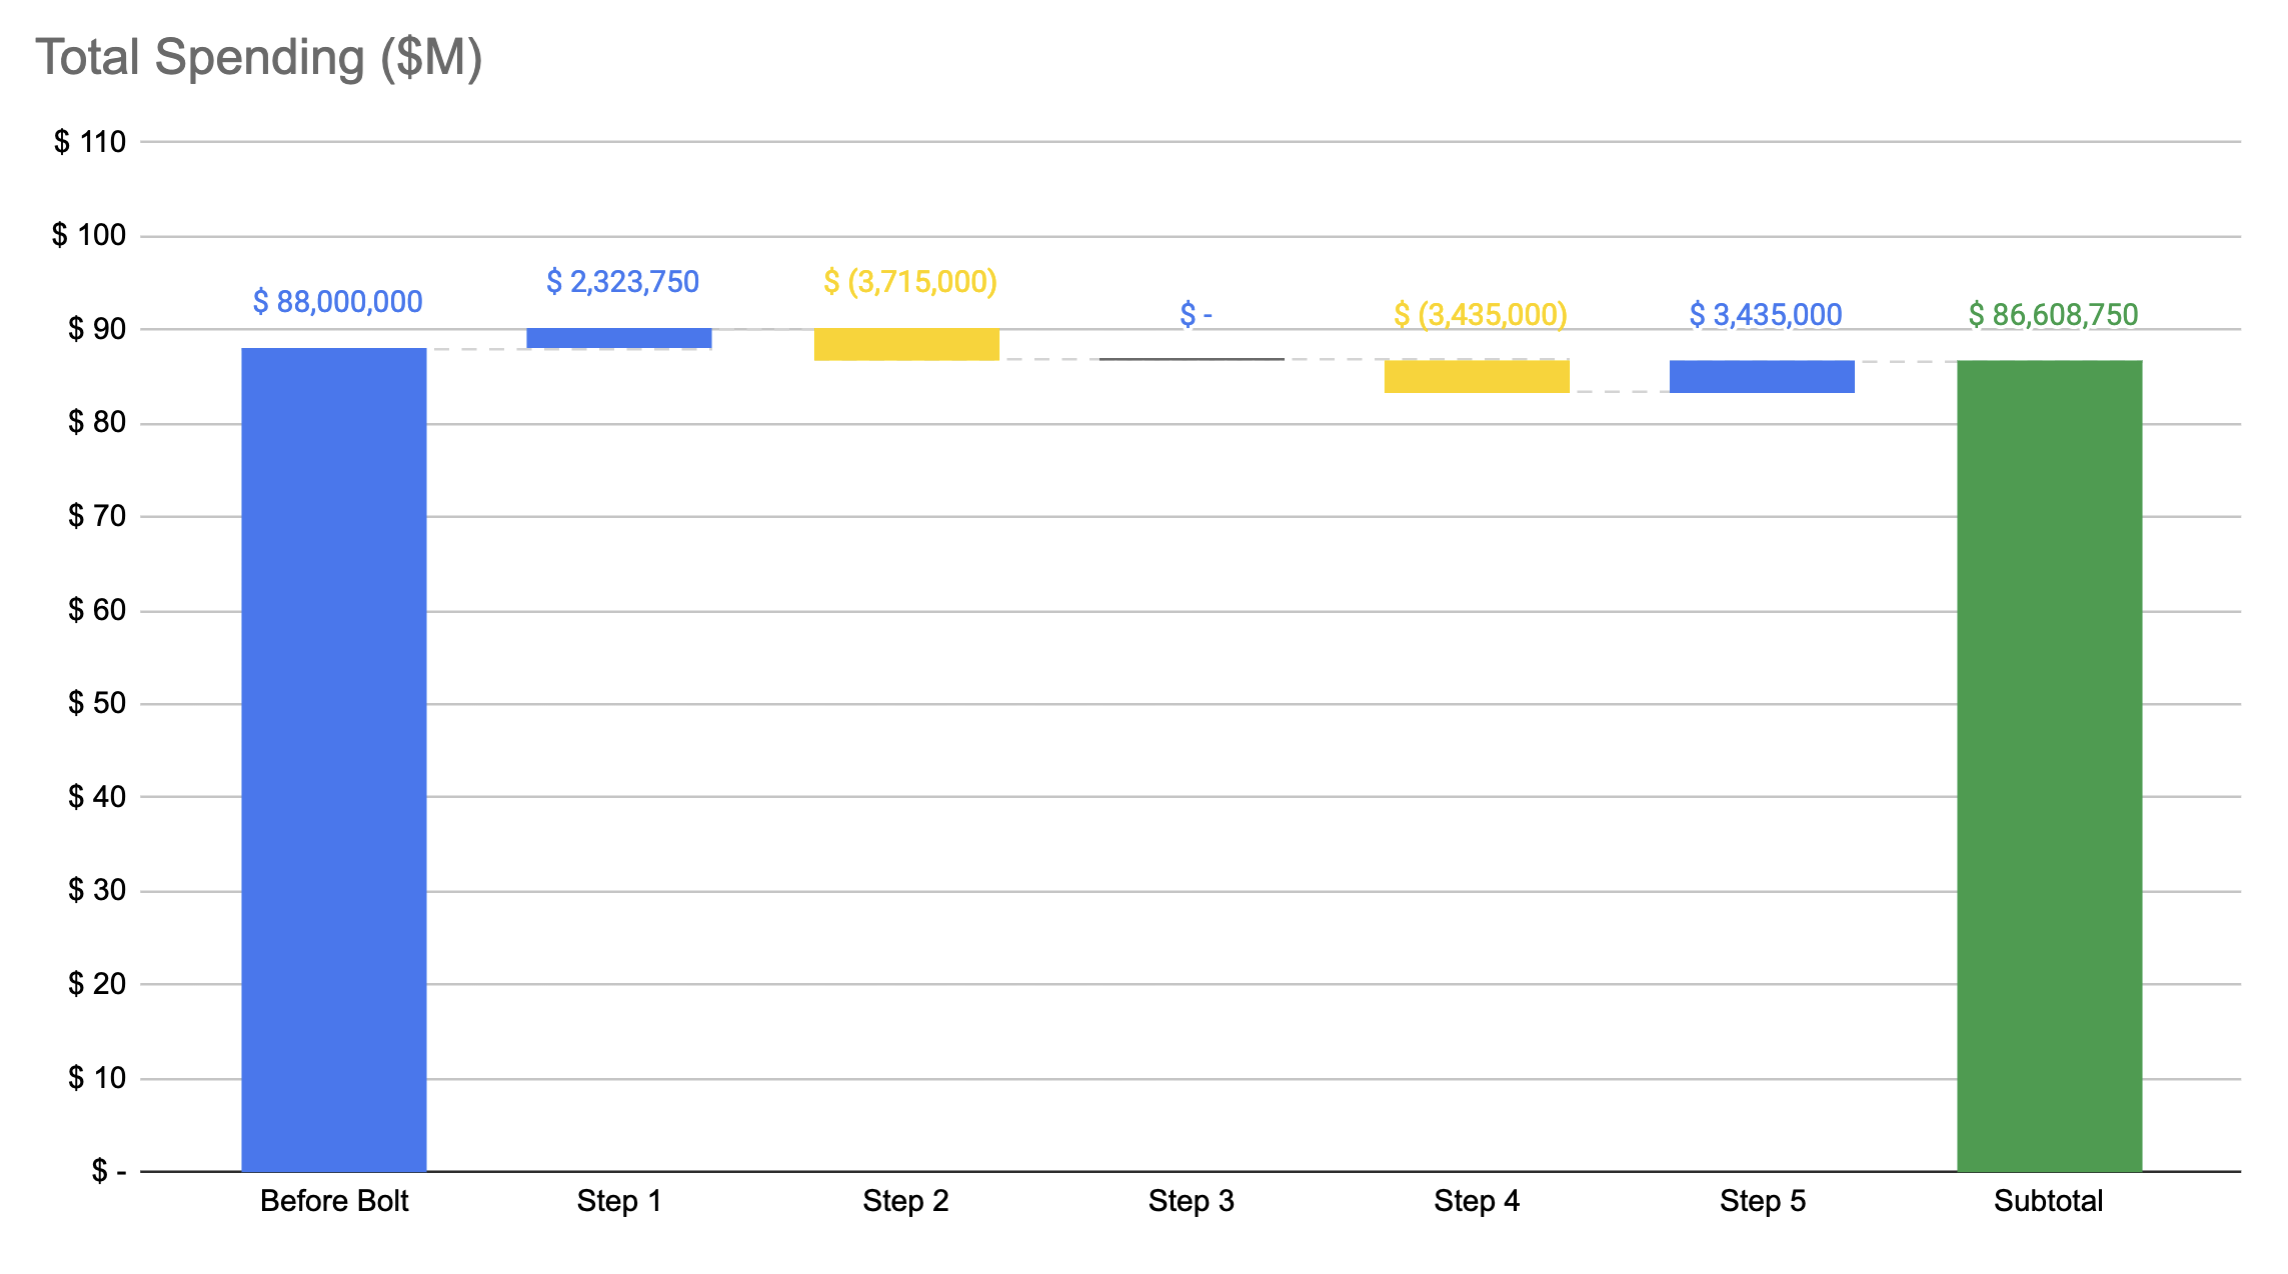
Waterfall View: (What is a waterfall chart?)
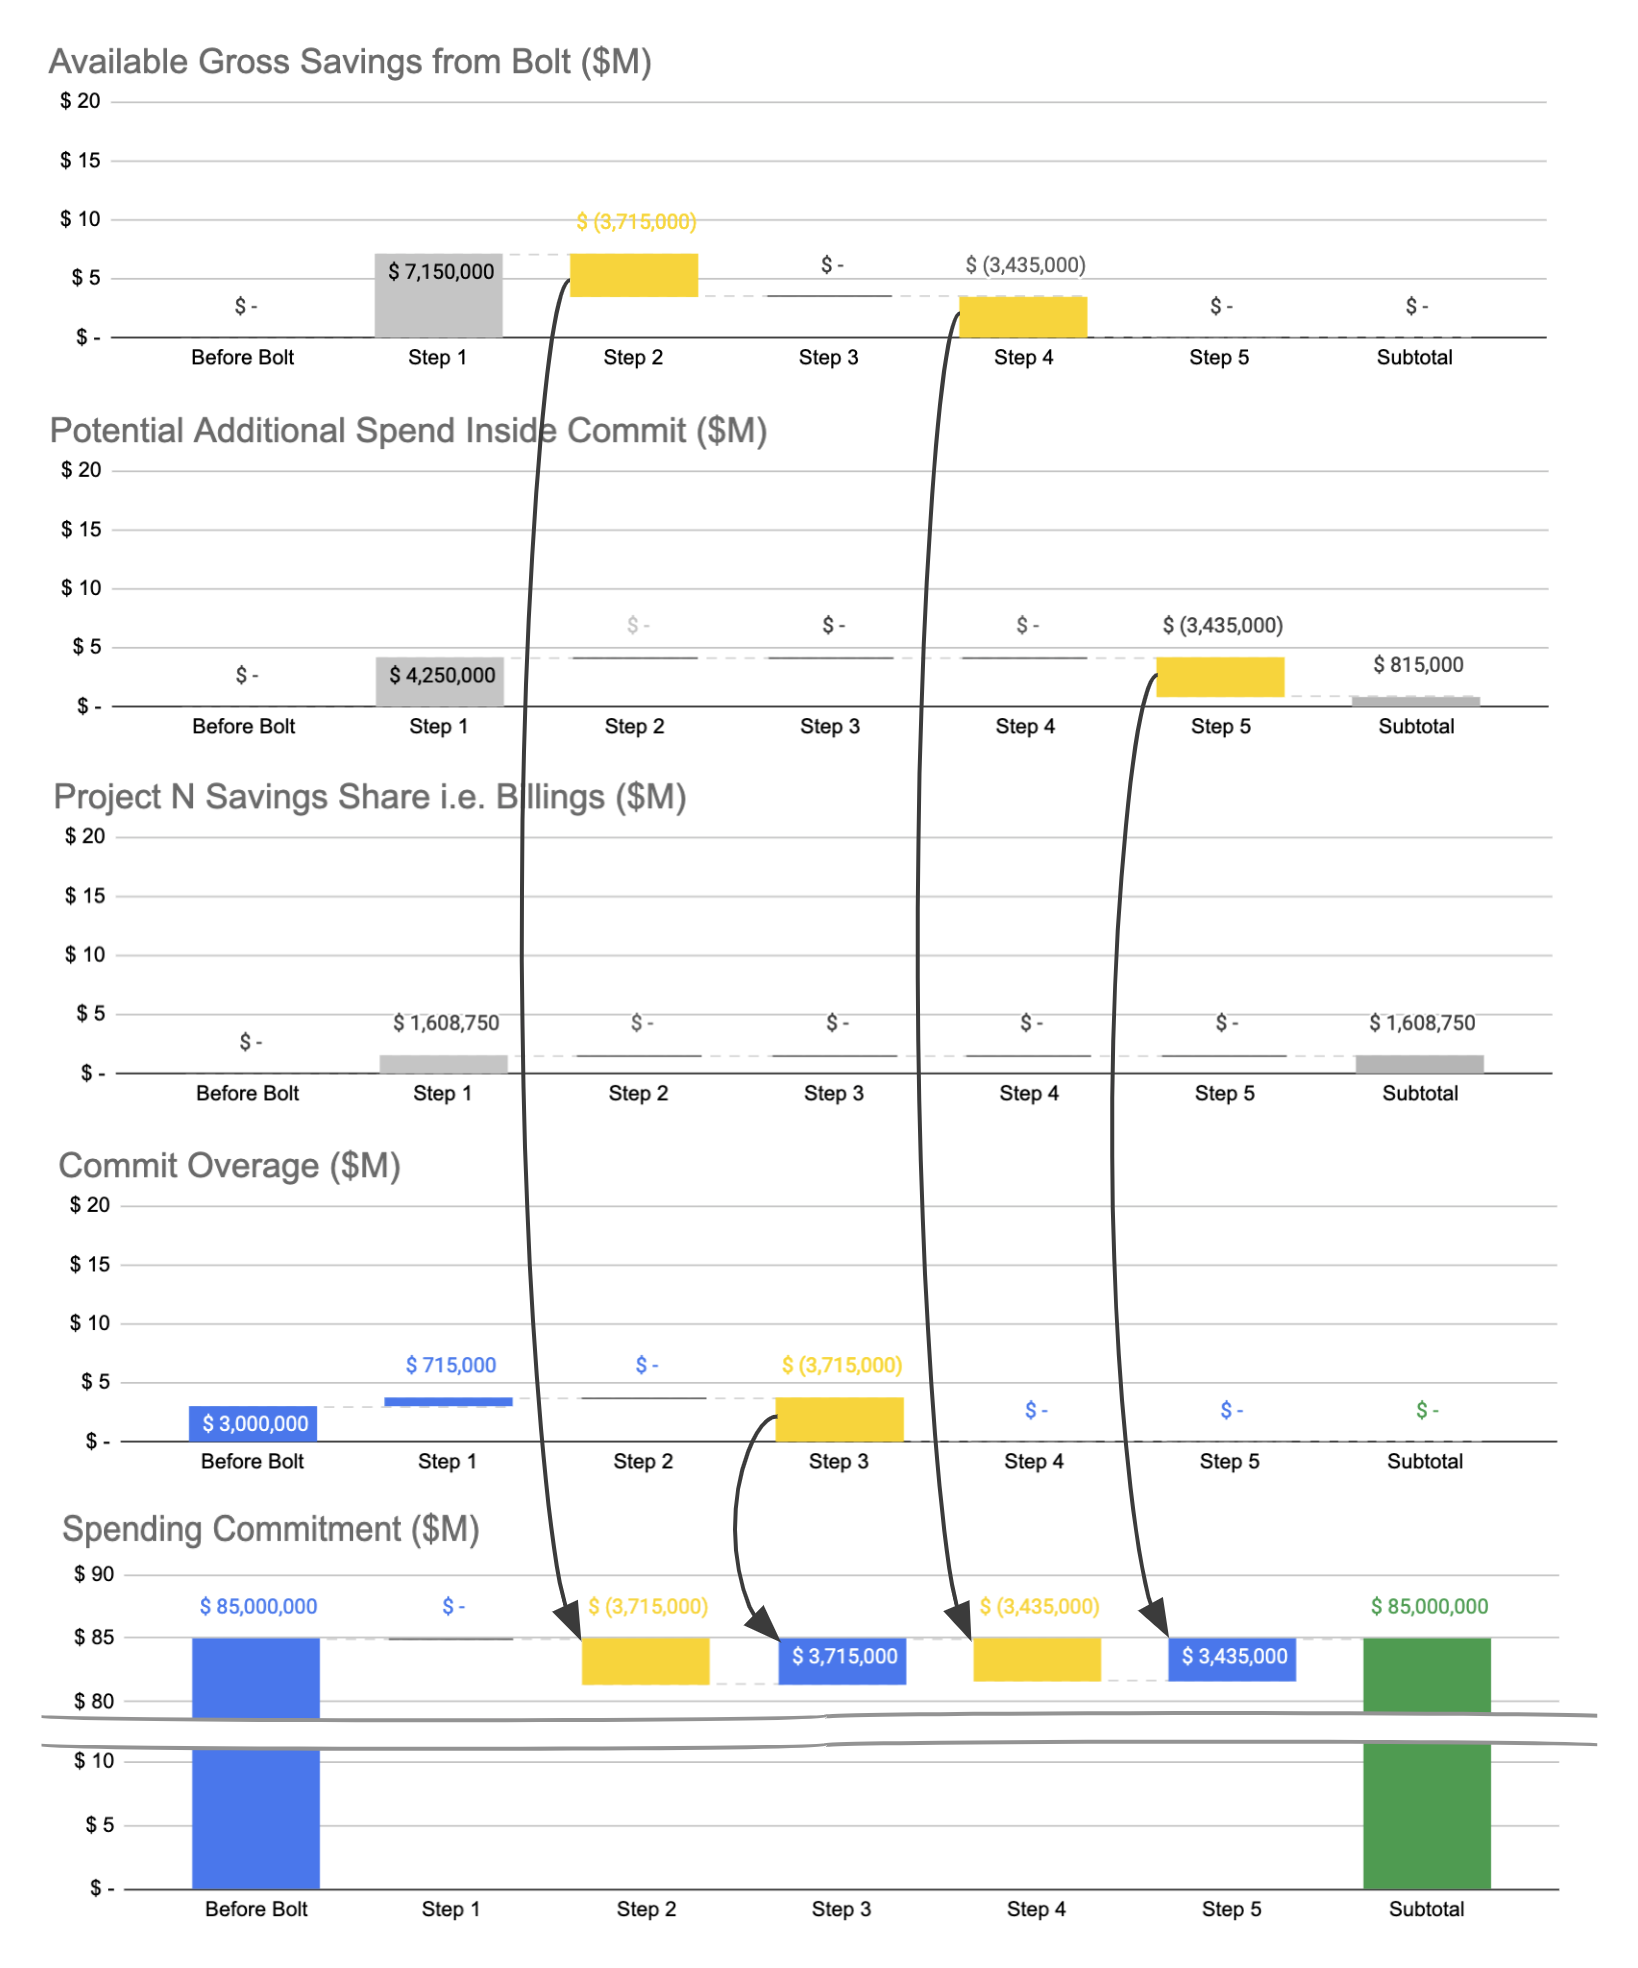
- Step 1: Crunch processes the data, generating both Gross Savings and infrastructure costs. In this step, infrastructure costs go temporarily to the Commit Overage, and Granica collects our Savings Share based on the free, net generated savings. Lastly, we see the Potential Additional Spend Inside Commit which will ultimately be used to realize value from Crunch.
- Step 2: The amount we can “spend” from Gross Savings is limited to the available Commit Overage of $3,715,000. Since that is less than our remaining Gross Savings we apply that entire amount to the Spending Commitment. The effect is to create a gap in the Commit, while also leaving a balance in available Gross Savings.
- Step 3: We fill the Commit gap using the entire available Commit Overage.
- Step 4: The amount we can “spend” from Gross Savings is now limited to the Potential Additional Spend Inside Commit of $4,250,000. Since that is greater than our remaining Gross Savings we can apply that entire remaining Gross Savings to the Spending Commitment.
- Step 5: We fill the Commit gap using the Potential Available Spend Inside Commit. The organization thus realizes $3,435,000 of free AWS spending (i.e. Crunch value realization) with no change to committed spending.
Putting this all together we see that total spending has been reduced by $1,391,250 and the organization has gained $3,435,000 in free AWS spend, i.e. 100% of the potential value from Crunch has been realized via a combination of savings and free spend. Also keep in mind that 100% of Granica billings have already been funded by the savings Crunch generated.
Three Consecutive EDP Terms (9 Years)
The following table illustrates spending and savings across three consecutive terms. For simplicity we assume that in both Terms 2 and 3 there is no change to the amount of underlying consumption represented by the spend. Said another way, in each term we expect $88M worth of underlying pre-Crunch consumption regardless of the reduced cost after Crunch.
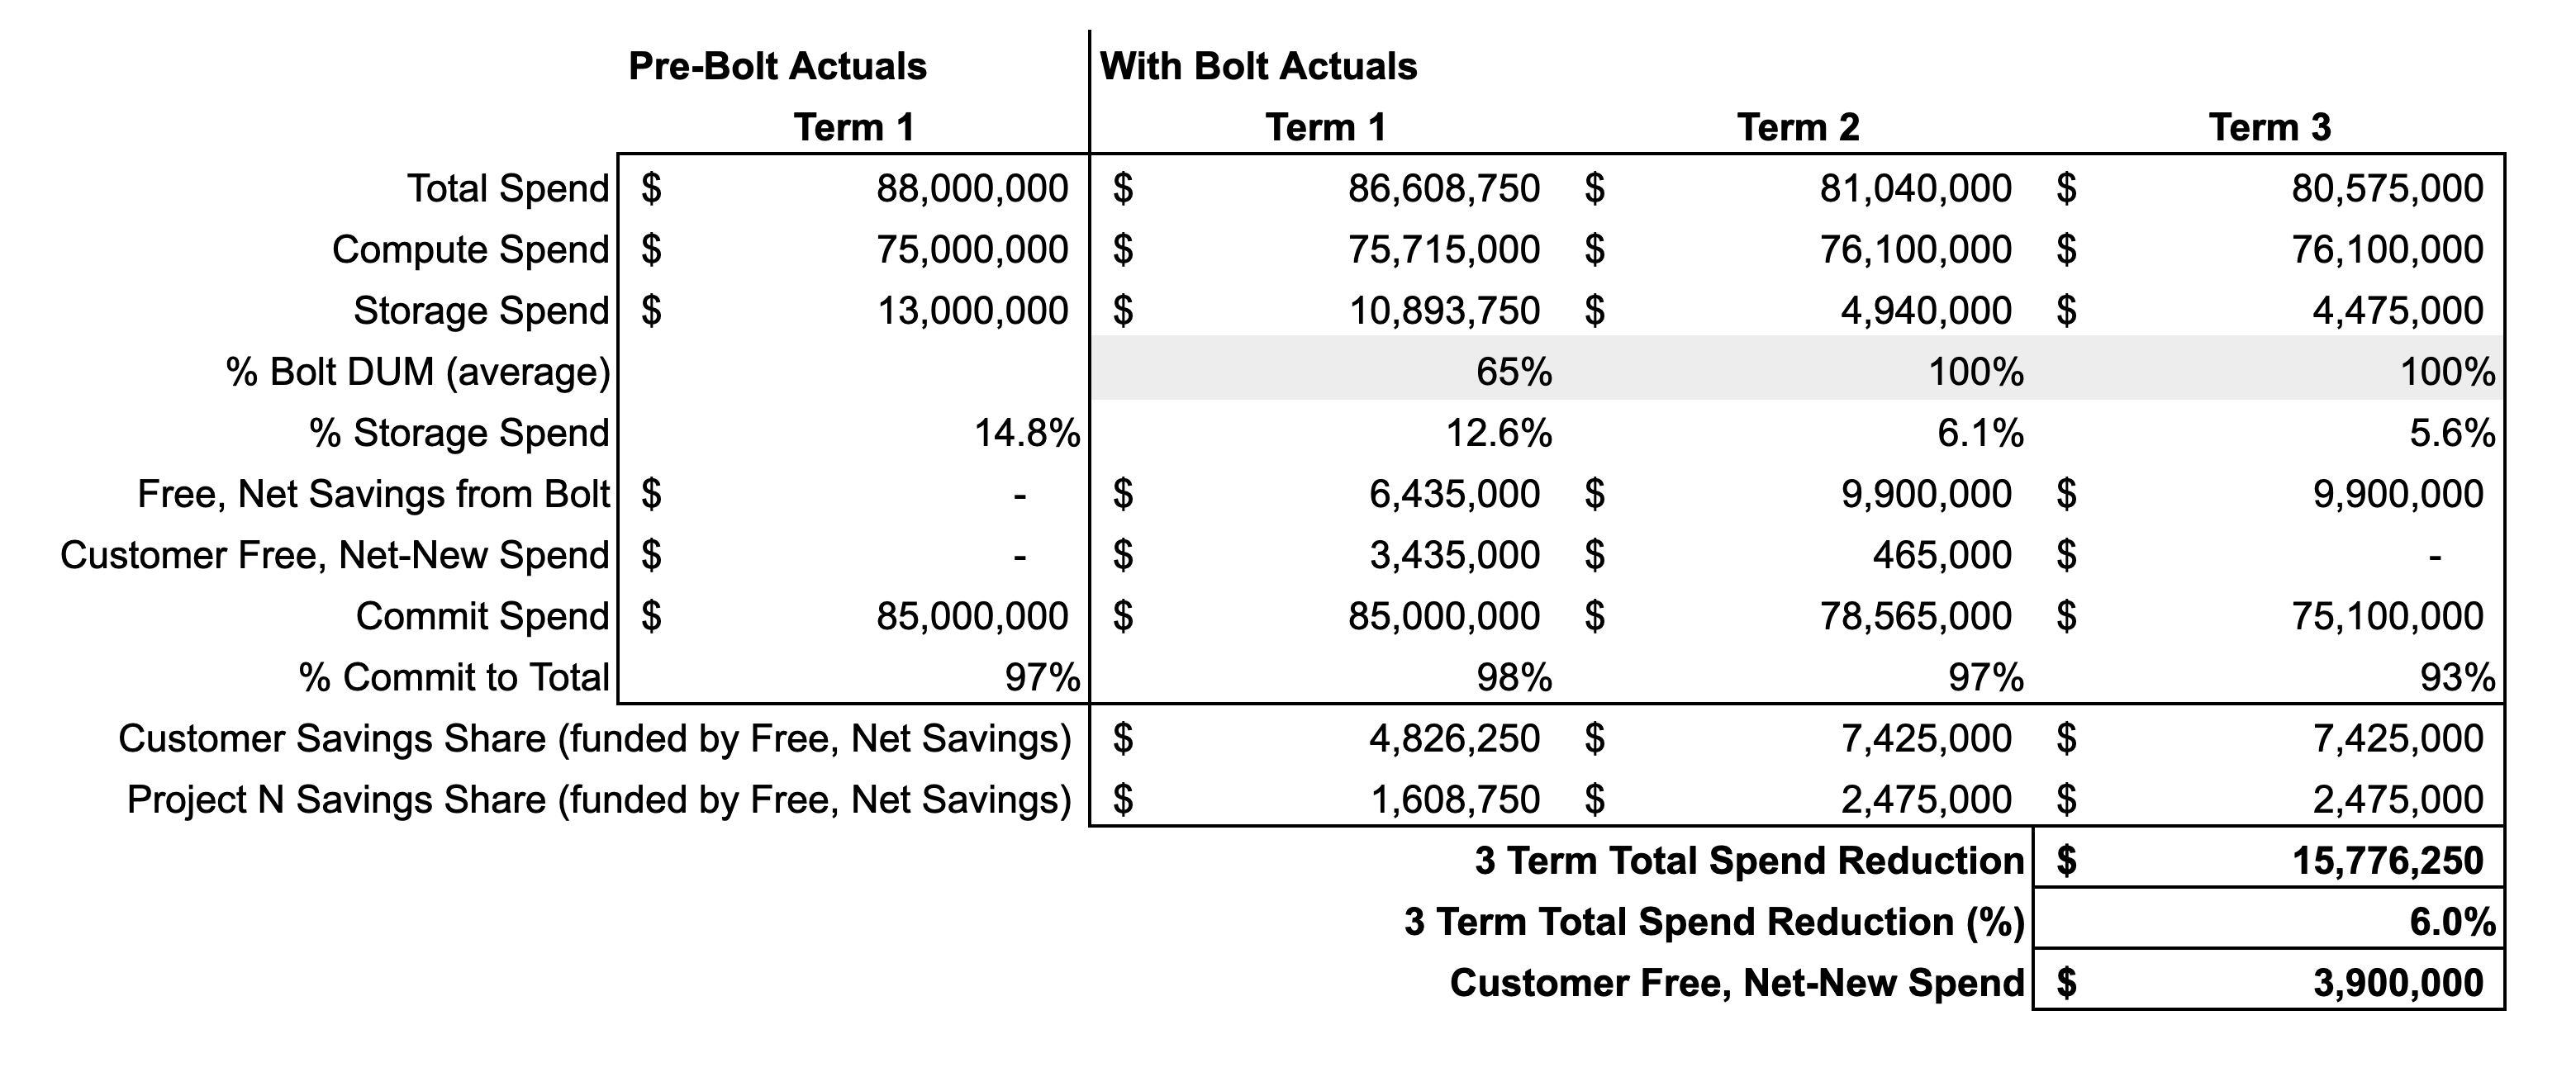
The Term 1 actuals (with Crunch) summarize the results we analyzed in the previous section. Once again there are two changes as we move from Term 1 into Term 2:
- We increase the % Crunch DUM (average) to 100%. This is because by the end of Term 1 all data associated with the spend will be under management and reduced by Crunch. For Term 2 (and beyond) Crunch is generating the maximum possible savings.
- We decrease the EDP Commit Spend by the Free, Net Savings generated in Term 1. This is because we now expect to save (at least!) that amount in Term 2, and we want to replenish the buffer between forecast and commit in case there is significant underconsumption in Term 2.
These changes result in:
- A slightly increased Compute Spend since Crunch is reducing more data than previously.
- Significantly lower Storage Spend, again since Crunch is reducing more data than previously.
- Significantly greater Free, Net Savings, again due to Crunch reducing more data.
- A lowered Commit Spend, and thus a % Commit to Total that is close to the Pre-Crunch Actuals.
- Both parties receive greater Savings Shares. Compared to the previous “typical” scenario, the majority of the Customer Savings Share value is realized through free, net-new AWS spending.
As we move from Term 2 into Term 3 we once again reduce the EDP Commit Spend by the incremental change in Free, Net Savings from Term 2. This helps push the % Commit to Total closer to the initial buffer based on the original expected $100M forecast and $85M commit.
All-in the organization saves ~$16M, or 6%, of total spend across the three terms. These savings are available for any use, whether to fund more cloud/IT projects (and their associated people and infrastructure) or to repurpose into other areas outside of IT. The organization also realizes $3.9M of free, net-new AWS spending.
Summary
Granica Crunch helps organizations realize significant value when used in combination with the AWS EDP program. When an organization’s actual spending is reasonably close to forecast, all of that value will be realized as repurposable savings. When the actual spending is very low relative to forecast, some of that value can be realized as free, net-new spending within AWS.
Given that most organizations actively monitor their actual spending over time and make adjustments along the way so that actuals come in reasonably close to forecast, the value from Crunch will likely always be fully realized as repurposable savings.